Resource material › Corporate Publications › Part Five: Forecast Financial Statements
In this section
- Financial Summary »
- Statement of Significant Underlying Assumptions »
- Statement of Significant Accounting Policies »
- Forecast Financial Performance »
- Forecast Financial Position »
- Forecast Cash Flows »
- Reconciliation of Forecast Net Cash Flows »
- Forecast Movement in Taxpayers' Funds »
- Forecast Property, Plant and Equipment »
- Capital Expenditure »
- Financial Results »
- Statement of Commitments »
- Memorandum Accounts »
- Financial Performance for Each Output Expense »
Financial Summary
Revenue
The Department of Internal Affairs expects to receive $197.070 million in revenue made up of:
- 41% Crown
- 6% government departments
- 53% third parties.
Expenditure
The Department expects to incur expenses of $195.141 million to deliver goods and services through 18 Departmental output expenses across six Votes.
Investment
The Department expects to receive a capital injection from the Crown of $5.042 million in the 2006/07 financial year:
- $3.019 million is to fund the Department's information technology infrastructure
- $2.010 million is to fund a database to secure and protect New Zealanders' identity information
- $0.013 million is to fund equipment required for monitoring of the Ruapehu Lahar.
Financial Forecast
| 2005/06 Budget (Supplementary Estimates) $000 | 2005/06 Estimated Actual $000 | 2006/07 Forecast (Main Estimates) $000 | |
|---|---|---|---|
| Revenue Crown | 83,892 | 83,892 | 81,122 |
| Revenue third parties | 99,076 | 95,076 | 115,948 |
| Total Revenue | 182,968 | 178,968 | 197,070 |
| Less total expenses | 187,317 | 181,317 | 195,141 |
| Net Surplus/(Deficit) | (4,349) | (2,349) | 1,929 |
| Taxpayers' funds* | 38,086 | 40,086 | 45,128 |
* (Crown's investment in the Department)
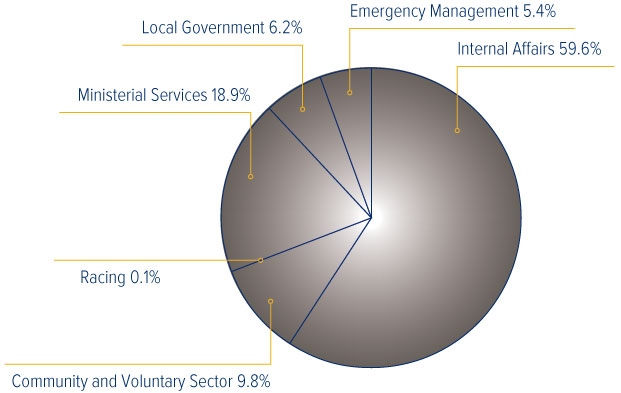
Percentage of Departmental Expense by Vote for 2006/07
Major Financial Changes
The main movements in Crown revenue between 2005/06 Supplementary Estimates ($83.892 million) and 2006/07 Main Estimates ($81.122 million) include:
- a decrease in funding of $2.457 million relating to the Commission of Inquiry into Police Conduct
- a decrease in funding of $925,000 relating to the Confidential Forum for Former Inpatients
- a decrease in funding of $800,000 due to the National Civil Defence and Emergency Management Public Education Programme
- a decrease in funding of $500,000 relating to the Working Group on Concerns of Viet Nam Veterans
- an increase in funding of $841,000 to enhance the capability of the Ministry of Civil Defence and Emergency Management
- a decrease in funding of $500,000 for the direct costs associated with anticipated visits and ceremonies, and the Commemorative Event Programme
- an increase in funding of $500,000 for the “public good” components of the marriage and civil union registration processes
- an increase in funding of $500,000 for additional staff to support the incoming Executive of the current Parliament
- an increase in funding of $360,000 to increase the staff capacity and capability within the Visits and Ceremonial Office
- an increase in funding of $200,000 for updating and providing ongoing support for the website CommunityNet Aotearoa
- an increase in funding of $200,000 for development of Evidence of Identity technical infrastructure
- an increase in funding of $100,000 for Evidence of Identity Custodianship of Standard.
Statement of Significant Underlying Assumptions
These forecast financial statements comply with generally accepted accounting practice.
The measurement base applied is historical cost adjusted for revaluations of assets. Revaluations are made to reflect the forecast service potential or economic benefit to be obtained through the control of assets.
These statements have been prepared on an ongoing basis for the period 1 July 2006 to 30 June 2007. Accrual accounting has been used to prepare these financial statements.
Statement of Significant Accounting Policies
Reporting Framework
The forecast financial statements for the Department of Internal Affairs have been prepared in accordance with section 38 of the Public Finance Act 1989.
The reporting entity is the Department of Internal Affairs. The reporting entity consists of those activities represented by outputs supplied by the Department and related assets, liabilities and taxpayers' funds.
The forecast financial statements show the financial performance and financial position after eliminating all significant intra-entity transactions between output expenses.
Actual results for 2006/07 are likely to vary from the information presented and the variations could be material. These variations would be mainly attributed to changes in the level of demand for services produced by the Department.
Inventories
Inventories or stock holdings are stated at the lower of cost or net realisable value. Costs are determined on a “first in, first out” basis.
Accounts Receivable
Accounts receivable are shown at expected net realisable value after making allowance for doubtful debts.
Financial Instruments
The Department is party to financial instrument arrangements as part of its daily operations. These include bank balances, accounts receivable, accounts payable and provisions, accrued expenses and foreign currency. Financial instruments are recognised in the Statement of Forecast Financial Position, except for foreign-exchange contracts.
All revenue and expenses in relation to financial instruments are recognised in the Statement of Forecast Financial Performance.
Capital Expenditure
The Departmental capital expenditure is incurred in accordance with section 24 of the Public Finance Act 1989.
Property, Plant and Equipment
Land and buildings are recorded at fair value, which has been determined by reference to the highest and best use of those assets, with buildings subsequently depreciated over their useful lives. Valuations are undertaken on a systematic basis, with sufficient regularity to ensure that no individual item of property, plant or equipment within a class is included at a valuation that is materially different from its fair value, at a minimum of every five years. Antiques and works of art are recorded at fair value and are not depreciated. All other fixed assets costing more than $3,000 are capitalised at cost and subsequently depreciated over their useful lives. Capital work in progress is recognised as costs are incurred. Depreciation is not recorded until the asset is fully acceptance tested and operational.
Depreciation
Depreciation is charged on all fixed assets except land, antiques and works of art, and capital work in progress. Assets are depreciated on a straight-line basis over their estimated useful life after allowing for residual values where appropriate. Revalued assets are depreciated on their revalued amount on a straight-line basis over their estimated useful life.
The estimated useful life of the different categories of assets owned by the Department is:
| Buildings | 33 years |
| Plant and equipment | 5-20 years |
| Furniture and fittings | 5-10 years |
| Office equipment | 5-10 years |
| Motor vehicles | 4-6 years |
| Information technology equipment | 3-5 years |
| Information technology software | 3-5 years |
| Births, Deaths and Marriages Historical Records Database | 10 years |
The cost of leasehold improvements is capitalised and amortised over the unexpired period of the lease or the estimated remaining useful life of the improvements, whichever is the shorter.
Capital work in progress is not depreciated. The total cost of the capital project is transferred to the appropriate asset on its completion and then depreciated.
Leases
The Department leases accommodation, motor vehicles and office equipment.
Operating Leases
The accommodation and motor vehicle leases are operating leases, where the lessor effectively retains substantial risks and benefits of ownership of the leased items. Operating lease costs are expensed in the period in which they are incurred.
Finance Leases
Leases which effectively transfer to the Department substantially the entire risks and benefits resulting from ownership of the leased items are classified as finance leases. These are capitalised at the lower of the fair value of the asset or the present value of the minimum lease payments. The leased assets and the corresponding lease liabilities are recognised in the Statement of Forecast Financial Position. The leased assets are depreciated over the life of the lease. Office equipment leases are identified as finance leases.
Employee Entitlements
Employee entitlements are recognised for annual leave at the time of entitlement based on current rates of pay. Retirement and long service leave are recognised on an actuarial basis according to entitlement based on service to date after making allowance for the average attrition rate.
Revenue Received in Advance
Revenue received in advance arises from services, such as passports and citizenship applications, required to be paid for at the time of application but are not delivered immediately. Revenue is recognised at time of service delivery.
Cost Allocation
The methods used in the allocation of costs are consistent between projected (budgeted) and actual figures. Costs of outputs are derived using the following cost-allocation system:
“Direct costs” are those costs directly attributed to an output and are treated as follows.
- Personnel costs are allocated on the basis of estimated time engaged in the delivery of a particular output.
- Operating costs are allocated on the basis of usage.
- Depreciation and capital charge are allocated on the basis of estimated asset utilisation.
- Accommodation costs are allocated on the basis of floor space occupied.
“Indirect costs” are those costs incurred by support units that are not directly attributable to an output.
- Indirect costs are allocated to outputs on an activity-costing basis reflecting a mix of perceived benefit, personnel numbers, floor space and estimated allocation of time.
Taxation
The Department is exempt from the payment of income tax in terms of the Income Tax Act 1994. Accordingly, no charge for income tax has been provided. The Department is subject to fringe benefit tax (FBT) and goods and services tax (GST). It administers pay as you earn (PAYE) tax.
Goods and Services Tax
The Departmental financial statements are prepared GST exclusive. The amount of GST owing to or from Inland Revenue at balance date is included in accounts receivable or payable as appropriate.
Foreign Currency Transactions
Foreign-exchange contracts are entered into for the primary purpose of reducing material exposure to fluctuations in foreign-currency exchange rates. The rates specified in foreign-exchange contracts are used to convert the transaction into New Zealand currency at the date of settlement. No exchange gains or losses resulting from the difference between the foreign-exchange contract rate and the spot-exchange rate on dates of settlement are recognised. Unhedged transactions in foreign currencies are converted into New Zealand currency using the exchange rate on the date of the transaction.
Monetary assets denominated in a foreign currency are translated to New Zealand dollars at the closing midpoint exchange rate.
Unrealised foreign-exchange gains and losses on overseas cash balances are recognised at balance date in the Statement of Forecast Financial Performance.
Changes in Accounting Policies
There are no changes in accounting policies for the 2006/07 financial year. The accounting policies have been applied on a basis consistent with the previous year.
Forecast Financial Performance
Statement of Forecast Financial Performance
for the year ending 30 June 2007
| 2005/06 Budget (Supplementary Estimates) $000 | 2005/06 Estimated Actual $000 | 2006/07 Forecast (Main Estimates) $000 | |
|---|---|---|---|
| Revenue | |||
| Crown | 83,892 | 83,892 | 81,122 |
| Departments | 10,980 | 10,980 | 10,939 |
| Other | 88,096 | 84,096 | 105,009 |
| Total Revenue | 182,968 | 178,968 | 197,070 |
| Expenses | |||
| Personnel | 97,401 | 94,901 | 99,374 |
| Operating | 81,144 | 77,644 | 83,011 |
| Depreciation | 6,302 | 6,302 | 9,573 |
| Capital charge | 2,470 | 2,470 | 3,183 |
| Total Output Expenses | 187,317 | 181,317 | 195,141 |
| Net Surplus/(Deficit) | (4,349) | (2,349) | 1,929 |
Forecast Financial Position
Statement of Forecast Financial Position
as at 30 June 2007
| 2005/06 Budget (Supplementary Estimates) $000 | 2005/06 Estimated Actual $000 | 2006/07 Forecast (Main Estimates) $000 | |
|---|---|---|---|
| Assets | |||
| Current Assets | |||
| Cash and bank balances | 20,898 | 22,898 | 31,187 |
| Prepayments | 110 | 110 | 85 |
| Inventories | 2,316 | 2,316 | 2,316 |
| Accounts receivable | 2,687 | 2,687 | 2,685 |
| Total Current Assets | 26,011 | 28,011 | 36,273 |
| Non-current Assets | |||
| Leased assets | 42 | 42 | 0 |
| Property, plant and equipment | 40,909 | 40,909 | 46,166 |
| Total Non-current Assets | 40,951 | 40,951 | 46,166 |
| Total Assets | 66,962 | 68,962 | 82,439 |
| Liabilities | |||
| Current Liabilities | |||
| Accounts payable | 4,872 | 4,872 | 8,281 |
| Provisions | 2,190 | 2,190 | 2,190 |
| Provision for payment of surplus | 0 | 0 | 1,929 |
| Accrued expenses | 10,763 | 10,763 | 13,778 |
| Finance leases | 42 | 42 | 0 |
| Revenue received in advance | 10,500 | 10,500 | 10,500 |
| Total Current Liabilities | 28,367 | 28,367 | 36,678 |
| Term Liabilities | |||
| Employee entitlements | 509 | 509 | 633 |
| Total Term Liabilities | 509 | 509 | 633 |
| Total Liabilities | 28,876 | 28,876 | 37,311 |
| Taxpayers' Funds | |||
| General funds | 37,269 | 39,269 | 44,311 |
| Revaluation reserve | 817 | 817 | 817 |
| Total Taxpayers' Funds | 38,086 | 40,086 | 45,128 |
| Total Liabilities and Taxpayers' Funds | 66,962 | 66,962 | 82,439 |
Forecast Cash Flows
Statement of Forecast Cash Flows
for the year ending 30 June 2007
| 2005/06 Budget (Supplementary Estimates) $000 | 2005/06 Estimated Actual $000 | 2006/07 Forecast (Main Estimates) $000 | |
|---|---|---|---|
| Cash Flows from Operating Activities | |||
| Cash provided from: | |||
| Supply of outputs to: | |||
| Crown | 83,892 | 83,892 | 81,122 |
| Departments | 12,223 | 12,223 | 10,939 |
| Other | 87,347 | 83,347 | 105,011 |
| Cash disbursed to: | |||
| Cost of producing outputs: | |||
| Output expenses | (183,200) | (177,200) | (175,854) |
| Capital charge | (2,470) | (2,470) | (3,183) |
| Net Cash Flows from Operating Activities | (2,208) | (208) | 18,035 |
| Cash Flows from Investing Activities | |||
| Cash provided from: | |||
| Sale of property, plant and equipment | 1,130 | 1,130 | 440 |
| Cash disbursed to: | |||
| Purchase of property, plant and equipment | (21,502) | (21,502) | (15,228) |
| Net Cash Flows from Investing Activities | (20,372) | (20,372) | (14,788) |
| Cash Flows from Financing Activities | |||
| Cash provided from: | |||
| Capital injection from the Crown | 11,856 | 11,856 | 5,042 |
| Cash disbursed to: | |||
| Payment of surplus to the Crown | (217) | (217) | 0 |
| Net Cash Flows from Financing Activities | 11,639 | 11,639 | 5,042 |
| Net increase/(decrease) in cash held | (10,941) | (8,941) | 8,289 |
| Total cash balances as at 1 July | 31,839 | 31,839 | 22,898 |
| Closing Total Cash Balances as at 30 June Projected | 20,898 | 22,898 | 31,187 |
Reconciliation of Forecast Net Cash Flows
Reconciliation of Forecast Net Cash Flows
from operating activities to net surplus/(deficit) in the Statement of Forecast Financial Performance for the year ending 30 June 2007
| 2005/06 Budget (Supplementary Estimates) $000 | 2005/06 Estimated Actual $000 | 2006/07 Forecast (Main Estimates) $000 | |
|---|---|---|---|
| Surplus/(Deficit) from Statement of Financial Performance | (4,349) | (2,349) | 1,929 |
| Add non-cash items | |||
| Depreciation | 6,302 | 6,302 | 9,573 |
| Movements in working capital items | |||
| (Increase)/Decrease in accounts receivable | 485 | 485 | 2 |
| (Increase)/Decrease in prepayments | 52 | 52 | 25 |
| (Increase)/Decrease in inventories | (315) | (315) | 0 |
| Increase/(Decrease) in accounts payable | (3,731) | (3,731) | 3,409 |
| Increase/(Decrease) in provisions | 257 | 257 | 0 |
| Increase/(Decrease) in accrued expenses | 1,054 | 1,054 | 3,015 |
| Increase/(Decrease) in finance leases | (215) | (215) | (42) |
| Increase/(Decrease) in revenue received in advance | (1,019) | (1,019) | 0 |
| Increase/(Decrease) in employee entitlements | (365) | (365) | 124 |
| Non-operating items included above | |||
| (Increase)/Decrease in accounts payable for property, plant and equipment | 225 | 225 | 0 |
| Transfer of non-cash current assets and liabilities to other departments | (589) | (589) | 0 |
| Net Cash Flows from Operating Activities | (2,208) | (208) | 18,035 |
Forecast Movement in Taxpayers' Funds
Statement of Forecast Movement in Taxpayers' Funds (Equity)
for the year ending 30 June 2007
| 2005/06 Budget (Supplementary Estimates) $000 | 2005/06 Estimated Actual $000 | 2006/07 Forecast (Main Estimates) $000 | |
|---|---|---|---|
| Net surplus/(deficit) for the year | (4,349) | (2,349) | 1,929 |
| Total Recognised Revenue and Expenses | (4,349) | (2,349) | 1,929 |
| Capital injection | 11,856 | 11,856 | 5,042 |
| Provision for payment of surplus | 0 | 0 | (1,929) |
| Asset/Liability transfers between departments | (603) | (603) | 0 |
| Movement in Taxpayers' Funds for the Year | 6,904 | 8,904 | 5,042 |
| Taxpayers' Funds as at 1 July | 31,182 | 31,182 | 40,086 |
| Taxpayers' Funds as at 30 June | 38,086 | 40,086 | 45,128 |
Forecast Property, Plant and Equipment
Statement of Forecast Property, Plant and Equipment
by category for the year ending 30 June 2007
| Estimated Actual 30 June 2006 | Forecast 30 June 2007 | |||||
|---|---|---|---|---|---|---|
| Cost or Valuation $000 | Accumulated Depreciation $000 | Carrying Amount $000 | Cost or Valuation $000 | Accumulated Depreciation $000 | Carrying Amount $000 | |
| Land | 3,930 | 0 | 3,930 | 3,930 | 0 | 3,930 |
| Buildings | 2,669 | 57 | 2,612 | 2,669 | 133 | 2,536 |
| Building alterations | 6,505 | 2,013 | 4,492 | 6,505 | 3,274 | 3,231 |
| Antiques and works of art | 408 | 0 | 408 | 408 | 0 | 408 |
| Furniture and fittings | 577 | 386 | 191 | 587 | 418 | 169 |
| Office equipment | 1,046 | 708 | 338 | 1,176 | 820 | 356 |
| Plant and equipment | 963 | 390 | 573 | 966 | 466 | 500 |
| Information technology hardware | 12,095 | 8,415 | 3,680 | 15,254 | 9,631 | 5,623 |
| Information technology software | 32,672 | 10,288 | 22,384 | 43,647 | 16,402 | 27,245 |
| Leased equipment | 427 | 385 | 42 | 427 | 427 | 0 |
| Motor vehicles | 3,994 | 1,693 | 2,301 | 4,078 | 1,910 | 2,168 |
| Total Property, Plant and Equipment | 65,286 | 24,335 | 40,951 | 79,647 | 33,481 | 46,166 |
Capital Expenditure
Capital Expenditure Summary
for the period 2001/02 to 2006/07
| 2001/02 Actual $000 | 2002/03 Actual $000 | 2003/04 Actual $000 | 2004/05 Actual $000 | 2005/06 Estimated Actual $000 | 2006/07 Forecast (Main Estimates) $000 | |
|---|---|---|---|---|---|---|
| Building alterations | 142 | 1,707 | 1,217 | 312 | 3,410 | 90 |
| Information technology hardware | 99 | 20 | 108 | 963 | 2,570 | 3,145 |
| Information technology software | 4,857 | 2,599 | 5,706 | 4,660 | 13,004 | 10,891 |
| Motor vehicles | 1,144 | 875 | 1,677 | 691 | 1,916 | 948 |
| Plant and equipment | 209 | 37 | 254 | 163 | 377 | 154 |
| Total Capital Expenditure | 6,451 | 5,238 | 8,962 | 6,789 | 21,277 | 15,228 |
The majority of capital expenditure forecast for 2006/07 is for the upgrade and development of information systems, databases and infrastructural information technology systems to enable the Department to provide quality information in an efficient manner and therefore aid in the production of efficient and effective services and quality policy advice.
Financial Results
Forecast Financial Results for the Department
for the year ending 30 June 2007
| Unit | 2005/06 Budget (Supplementary Estimates) | 2005/06 Estimated Actual | 2006/07 Forecast (Main Estimates) | |
|---|---|---|---|---|
| Operating Results | ||||
| Revenue: other | $000 | 88,096 | 84,096 | 105,009 |
| Revenue: Department | $000 | 10,980 | 10,980 | 10,939 |
| Total expenses | $000 | 187,317 | 181,317 | 195,141 |
| Operating surplus before capital charge | $000 | (1,879) | 121 | 5,112 |
| Net Surplus/(Deficit) | $000 | (4,349) | (2,349) | 1,929 |
| Working Capital | ||||
| Liquid ratio | 0.74:1 | 0.81:1 | 0.85:1 | |
| Current ratio | 0.92:1 | 0.99:1 | 0.99:1 | |
| Average debtors outstanding | Days | 11 | 11 | 8 |
| Average creditors outstanding | Days | 30 | 32 | 29 |
| Resource Utilisation | ||||
| Property, plant and equipment | ||||
| Property, plant and equipment as % of total assets | % | 61 | 59 | 56 |
| Additions as % of property, plant and equipment | % | 53 | 53 | 33 |
| Taxpayers' funds | ||||
| Level at year-end | $000 | 38,086 | 40,086 | 45,128 |
| Forecast Net Cash Flows | ||||
| Surplus/(Deficit) from operating activities | $000 | (2,208) | (208) | 18,035 |
| Deficit from investing activities | $000 | (20,372) | (20,372) | (14,788) |
| Surplus/(Deficit) from financing activities | $000 | 11,639 | 11,639 | 5,042 |
| Net increase/(decrease) in cash held | $000 | (10,941) | (8,941) | 8,289 |
Forecast Statement of Commitments
Forecast Statement of Commitments
as at 30 June 2007
| 2005/06 Estimated Actual $000 | 2006/07 Forecast (Main Estimates) $000 | |
|---|---|---|
| OPERATING COMMITMENTS | ||
| Non-cancellable Accommodation Leases | ||
| Less than one year | 7,091 | 5,833 |
| One to two years | 6,367 | 1,996 |
| Two to five years | 6,234 | 3,468 |
| Over five years | 1,102 | 319 |
| Total Accommodation Commitments | 20,794 | 11,616 |
| Other Non-cancellable Leases | ||
| Less than one year | 438 | 357 |
| One to two years | 269 | 11 |
| Two to five years | 11 | 0 |
| Total Other Lease Commitments | 718 | 368 |
| Non-cancellable Contracts for the Supply of Goods and Services | ||
| Less than one year | 1,369 | 1,343 |
| Total Supply Commitments | 1,369 | 1,343 |
| Total Commitments | 22,881 | 13,327 |
Memorandum Accounts
Forecast for the year ending 30 June 2007
Memorandum accounts are notional accounts to record the accumulated balance of surpluses and deficits for outputs funded by fees charged to third parties. They are intended to provide a long-run perspective to the pricing of outputs.
| Forecast Closing Balance 30/06/2006 $000 | Forecast Movement During 2006/07 $000 | Forecast Closing Balance 30/06/2007 $000 | |
|---|---|---|---|
| New Zealand Gazette | 16 | 0 | 16 |
| Use of facilities and access to Lake Taupo by boat users | 39 | (24) | 15 |
| Passport products | 1,056 | 4,362 | 5,418 |
| Citizenship products | (2,439) | (59) | (2,498) |
| Marriage products | 438 | (152) | 286 |
| Issue of birth, death and marriage certificates and other products | 1,646 | (276) | 1,370 |
| Administration of non-casino gaming | (3,580) | (2,889) | (6,469) |
This statement is to be read in conjunction with the Statement of Accounting Policies and Notes to the Financial Statements. The Memorandum Accounts were established on 30 June 2002.
Action Taken to Address Surpluses and Deficits
New Zealand Gazette
The cost of publishing and distributing the New Zealand Gazette is recovered through third party fees. The surplus generated in any one year is to be offset against costs in future years. The accumulated surplus will be examined in the next pricing review.
Use of Facilities and Access to Lake Taupo by Boat Users
The Department of Internal Affairs manages marina berths, jetties and boat ramps located around Lake Taupo. Fees are charged to third parties who use marina berths and boat ramps. Fee income is applied to recover the maintenance and administration cost of these facilities. The accumulated surplus will be applied to maintenance of facilities. Major items of maintenance occur at irregular intervals and may be deferred due to unfavourable climatic or lake conditions.
Passport Products
The purpose of this account is to support a strategy to stabilise fees based on full cost recovery over a four to five-year planning horizon. This strategy supports the introduction of new technologies, including the replacement of the ageing passport system, within that timeframe. The current fees schedule was introduced on 4 November 2005. The forecast accumulated surplus on this account, along with underlying assumptions about the forecast number of passports to be issued, will be examined in the next pricing review.
Citizenship Products
The purpose of this account is to support a strategy to stabilise fees based on full cost recovery over a four to five-year planning horizon. The accumulated forecast deficit in this account reflects the period of time when citizenship fees were not based on full cost recovery and volumes were lower than those used for pricing purposes. The current fees schedule was introduced on 1 September 2003 based on full cost recovery. The forecast accumulated deficit in this account will be examined in the next pricing review.
Marriage Products
The current fees schedule for marriage products was introduced on 1 September 2003 based on full cost recovery. The small forecast surplus in this account reflects volume increases over levels assumed for pricing purposes. The purpose of this account is to support a strategy to stabilise fees based on full cost recovery over a four to five-year planning horizon. The forecast accumulated surplus in this account will be examined in the next pricing review.
Issue of Birth, Death and Marriage Certificates and Other Products
The fees schedule for birth, death and marriage products was introduced on 1 September 2003 based on full cost recovery. The small forecast deficit in this account reflects volume decreases over levels assumed for pricing purposes. The purpose of this account is to support a strategy to stabilise fees based on full cost recovery over a four to five-year planning horizon. The forecast accumulated surplus in this account will be examined in the next pricing review.
Administration of Non-casino Gaming
Fees established to recover the cost of administration and regulation of non-casino gaming are reflected in specific licence fees for various types of gaming activity and the registration of gaming machines. The fees schedule has recently been implemented as part of the implementation of the Gambling Act 2003 with effect from 1 July 2004. In setting the fees, costs and revenue were forecast to offset over a six-year planning horizon as the electronic monitoring of gaming machines is phased in during 2006/07.
Forecast Financial Performance for Each Output Expense
Forecast Financial Performance for Each Output Expense
for the year ending 30 June 2007
| Departmental Output Expense | Revenue Crown $000 | Revenue Depts $000 | Revenue Other $000 | Total Expenses $000 | Surplus/ (Deficit) $000 | Output Expense Descriptions Links |
|---|---|---|---|---|---|---|
| Vote Community and Voluntary Sector | ||||||
| Administration of Grants | 4,340 | 465 | 7,102 | 11,905 | 2 | Link |
| Community Advisory Services | 5,402 | 114 | 9 | 5,526 | (1) | Link |
| Policy Advice – Community | 1,660 | 24 | 0 | 1,685 | (1) | Link |
| Vote Emergency Management | ||||||
| Management of National Emergency Readiness, Response and Recovery | 3,312 | 24 | 0 | 3,336 | 0 | Link |
| Policy Advice – Emergency Management | 1,766 | 14 | 0 | 1,780 | 0 | Link |
| Support Services, Information and Education | 5,509 | 28 | 0 | 5,539 | (2) | Link |
| Vote Internal Affairs | ||||||
| Gaming and Censorship Regulatory Services | 1,916 | 219 | 18,277 | 22,340 | (1,928) | Link |
| Identity Services | 8,416 | 1,085 | 77,552 | 83,175 | 3,878 | Link |
| Information and Advisory Services | 498 | 642 | 594 | 1,733 | 1 | Link |
| Policy Advice – Internal Affairs | 4,811 | 90 | 0 | 4,901 | 0 | Link |
| Services for Ethnic Affairs | 2,660 | 518 | 0 | 3,179 | (1) | Link |
| Contestable Services | 0 | 144 | 791 | 935 | 0 | Link |
| Vote Local Government | ||||||
| Information, Support and Regulatory Services | 3,999 | 91 | 562 | 4,670 | (18) | Link |
| Policy Advice – Local Government | 7,317 | 69 | 0 | 7,386 | 0 | Link |
| Vote Ministerial Services | ||||||
| Support Services to Ministers | 25,908 | 303 | 35 | 26,245 | 1 | Link |
| VIP Transport | 0 | 7,093 | 82 | 7,175 | 0 | Link |
| Visits and Official Events Coordination | 3,396 | 12 | 5 | 3,414 | (1) | Link |
| Vote Racing | ||||||
| Policy Advice – Racing | 212 | 4 | 0 | 217 | (1) | Link |
| TOTAL DEPARTMENT | 81,122 | 10,939 | 105,009 | 195,141 | 1,929 | |
