Gaming machine profits (GMP dashboard)
Dashboard file showing current quarter, and historic data for the numbers of electronic gaming machines (EGMs)and licenced premises in each council area, reported since 2015.
On this page
Dashboard
Last updated: 28 November 2025
Gaming Machine Profits (GMP) Dashboard (data.govt.nz website PowerBI and machine-readable formats)
A new Power BI version of the Quarterly GMP dashboard is now available through data.govt.nz. This dashboard has now prepaced the previous Excel dashboard: GMP Quarterly Dashboard (data.govt.nz)
The PowerBI dashboard contains several reports. Explanations to help you understand the information, and what it shows, are provided below
The dashboard shows the numbers of approved gaming machines licensed to operate at approved venues as at the last day of the current quarter.
This is a 'snapshot' of the current state of affairs at a point in time. It is not conclusive and should be read in the context of the broader dataset.
Contact us if you want up to date information about machine numbers in a district.
Notes and Corrections
December 2024 - Rolling up of Central Hawke's Bay District to Hastings District
During the December 2024 quarter, a venue in the Central Hawkes Bay District surrendered its venue licence and was no longer licenced to operate class 4 gaming machines as at the end of the quarter. This dropped the number of venues in the Central Hawke's Bay District to one. As with similar scenarios (Kaikoura District, Stratford District) in the past, we have combined/rolled up this Territorial Authority with Hastings District, as not to expose venue-level GMP of this single venue, as per departmental policy that we do not publish venue-level GMP. We have chosen to combine Central Hawke's Bay District with Hastings District due to the geographic proximity of the venues and the deprivation levels of the venues being relatively similar.
For more detail on these numbers and trends, please see our GMP Dashboard.
Gaming Machine Profits (GMP) insights July to September 2025
General insights
- Quarterly GMP for July to September 2025 increased by 4.46 percent compared to the June 2025 quarter, rising from $255,196,768.72 to $266,575,251.44. When adjusted for inflation, quarterly GMP increased by 3.48 percent, rising from $190,376,789.45 to $196,993,785.85.
- This is the third highest September quarterly GMP since we began reporting in this format, the highest being $276,301,503.20 in the September 2022 quarter. The increase between June and September quarters is consistent with recent trends (except during the 2021 COVID lockdown).
- The rolling 12-month total GMP for the year ending September 2025 increased slightly by 0.34 percent (by $3,462,774.70 to $1,018,821,336.34). While we have seen a slight increase this quarter, rolling GMP has been trending down since its peak in June 2023 at $1,070,228,393.57, but remains over one billion dollars. When adjusted for inflation, the rolling 12-month total GMP for the year ending September 2025 decreased slightly by 0.42 percent (from $765,194,796.82 to $761,959,960.88).
- The number of venues and electronic gaming machines (EGMs) operating at the end of the quarter have both decreased. The number of venues decreased by 6 from 965 to 959. The number of EGMs decreased by 38 from 13,810 to 13,772. These decreases follow overall trends we have seen since reporting began.
- Average GMP per EGM increased by 4.7 percent from the June quarter to the September quarter, rising from $18,479 to $19,356. When adjusted for inflation, average GMP per EGM increased by 3.7 percent, rising from $13,785 to $14,304. The increase in GMP per EGM this quarter can likely be attributed to an increase in GMP between quarters as well as decrease in the number of EGMs.
Regional insights
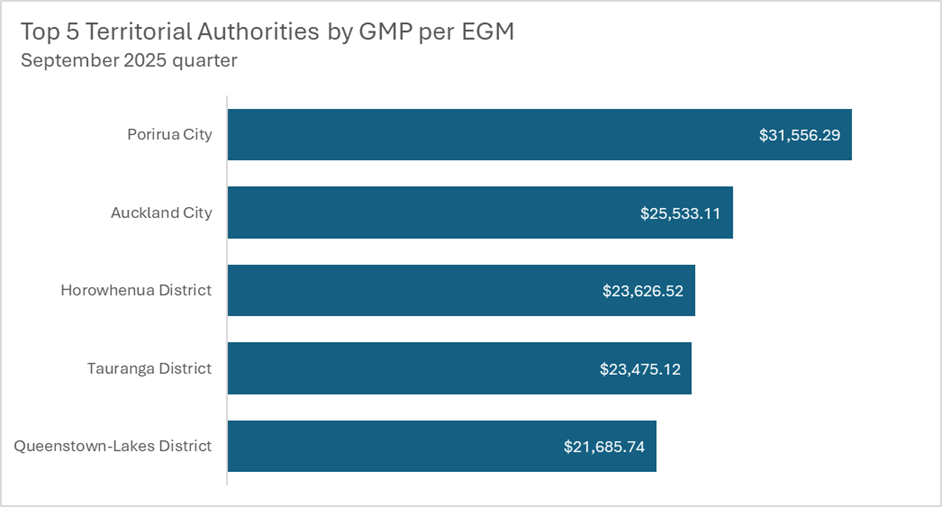
- From July to September 2025, GMP per EGM was highest in Porirua City, followed by Auckland City, Horowhenua District, and Tauranga District. These districts remain in the top five highest Territorial Authorities (TAs) for value of GMP per EGM. Queenstown-Lakes District had the fifth highest GMP per EGM this quarter, bumping Hastings District down to seventh.
- Mackenzie District has the lowest GMP per EGM with $7,381.08 compared to Porirua City’s $31,556.28.

For more detail on these numbers and trends, please see our GMP Dashboard.
Interpreting the data
There are several reports within the PowerBI version (human readable) of the GMP dashboard:
- Class 4 Key Statistics - Key stats about the current quarter, filterable by location
- Gaming Machine Statistics - Dynamic dashboard that allows you to select financial information you want to see based on time and location.
- Venues and EGMs - Dynamic dashboard that allows you to select venue and EGM information you want to see based on time and location.
- In Detail – Tables – Quarterly and yearly tables showing financial and venue/EGM information and the delta between each quarter/year that you want to see based on time and location.
- Quarterly GMP, Venues and EGMs – A table showing a single quarter of data, showing the percentage of total GMP, EGMs and venues for the selected location(s) and quarter.
- Dataset - Data that sits behind all the dynamic tables and dashboards.
- Current Quarter Venues – A list of venues licenced at the end of the quarter.
Two additional sheets provide help for navigating and reading the data:
- Contents and directions – instructions for how to navigate the dashboard and view the information you need. It covers how to:
- Navigate between pages
- Use filters/slicers to manipulate different views
- Uncover detail behind the graphs
- Troubleshoot
- Notes and Caveats to the Data – details what is, and is not, included in the data.