- Pūrongo ā-Tau 2022-23
- SECTION 1
Our year in review - SECTION 2
Making New Zealand better for New Zealanders - SECTION 3
A high-performing organisation and a great place to work - SECTION 4
Māori-Crown Relations Capability - SECTION 5
Carbon Neutral Government Programme - SECTION 6
Annual Report of the Ministry for Ethnic Communities - SECTION 7
Digital Executive Board Annual Report 2022/23 - SECTION 8
Financial and non-financial results - SECTION 9
Appendices - SECTION 10
Glossary (Appendix E)
- SECTION 1
Go to the Contents View or download the PDF version Go to the next section
5. Te Hōtaka Tukuwaro-kore a te Kāwanatanga
Carbon Neutral Government Programme
About this section
As part of the Carbon Neutral Government Programme (CNGP), Te Tari Taiwhenua is required to measure, verify, report and reduce our greenhouse gas (GHG) emissions. This section provides a summary from our annual GHG emissions inventory report for the financial year 2022/23.
Te Hōtaka Tukuwaro-kore a te Kāwanatanga
Carbon Neutral Government Programme
Carbon emissions reporting
In December 2020, the New Zealand Government declared a climate emergency, committing to urgent action to reduce greenhouse gas (GHG) emissions and limit temperature rise to 1.5 degrees Celsius above pre-industrial levels. In response, the Carbon Neutral Government Programme (CNGP) was launched to accelerate the reduction of public sector emissions and achieve carbon neutrality by 2025.
As part of the CNGP, Te Tari Taiwhenua is expected to:
- measure, verify and report GHG emissions annually
- set gross emissions reduction targets and longer-term reduction plans
- introduce a phased work programme to reduce the organisation’s emissions
- offset remaining emissions to achieve carbon neutrality by December 2025.
Te Tari Taiwhenua reports emissions from departmental and non-departmental activities. The departmental activities include the Ministry for Ethnic Communities, a departmental agency hosted by Te Tari Taiwhenua. The non-departmental activities mainly include travel by Members of the Executive and approved accompanying parties (that is, Ministerial travel) and the operation of Ministerial properties.
Change in base year to financial year 2022/23
We have changed our base year from 2020/21 to 2022/23. Operations in both 2020/21 and 2021/22 were significantly impacted by COVID-19 pandemic restrictions and the New Zealand border closure, so were not representative of our typical emissions profile for travel and freight (for example, the delivery of identity products such as passports), some of our largest emissions sources. Through further quality assurance work and improvement in data collection processes, we have identified new emissions sources that were not previously measured and reported. We believe 2022/23 is a good representation of emissions for Te Tari Taiwhenua.
Our total gross emissions for 2022/23, the new base year, were 8,328 tonnes of carbon dioxide equivalent (tCO2e). Table 1 breaks down emissions by scope (GHG Protocol 2004) and between departmental and non-departmental activities. Emissions from non-departmental activities have been separately disclosed as we have a lower level of influence on our ability to reduce emissions from these activities.
Air travel is our largest emissions source, contributing to 47.6 percent (3,965 tCO2e) of the total emissions, followed by stationary combustion at 10.8 percent (898 tCO2e), staff commuting at 9.9 percent (826 tCO2e) and freight at 9.5 percent (795 tCO2e). Air travel, freight and stationary combustion, staff commuting and freight represent 78 percent of total emissions. Ministerial travel is 24.6 percent of the total emissions.
In 2022/23, Te Tari Taiwhenua purchased 1,678 carbon credits through Toitū Envirocare (Enviro-Mark Solutions Limited) to partially offset emissions from Ministerial travel. The emissions reported in Table 1 were assessed prior to these offsets.
Table 1: Summary of 2022/23 GHG gross emissions in tCO2e
|
Emissions source |
Departmental |
Non-departmental |
2023 |
% of Total |
|---|---|---|---|---|
|
Scope 1: Direct emissions |
977 |
188 |
1,165 |
14.0% |
|
Stationary combustion [ 1 ] |
852 |
46 |
898 |
10.8% |
|
Transport fuels |
114 |
142 |
256 |
3.1% |
|
Refrigerant gases |
11 |
- |
11 |
0.1% |
|
Scope 2: Indirect emissions from imported energy |
733 |
5 |
738 |
8.9% |
|
Electricity |
733 |
5 |
738 |
8.9% |
|
Scope 3: Other indirect emissions |
4,291 |
2,134 |
6,425 |
77.1% |
|
Business travel – air travel |
1,916 |
2,049 |
3,965 |
47.6% |
|
Staff commuting (non-mandatory) |
826 |
- |
826 |
9.9% |
|
Freight |
795 |
- |
795 |
9.5% |
|
Business travel – other |
308 |
82 |
390 |
4.7% |
|
Staff working from home |
136 |
- |
136 |
1.6% |
|
Waste (to landfill) |
109 |
- |
109 |
1.3% |
|
Wastewater |
89 |
- |
89 |
1.1% |
|
Transmission and Distribution losses (electricity) |
82 |
1 |
83 |
1.0% |
|
Transmission and Distribution losses (natural gas) |
30 |
2 |
32 |
0.4% |
|
Total gross emissions (tCO2e) |
6,001 |
2,327 |
8,328 |
100.0% |
Note 1 – Stationary combustion includes natural gas, diesel and LPG.
Emissions intensity by full-time equivalent (FTE) staff and expenditure
To help understand how changes in funding and staff may affect carbon emissions and monitor progress against reduction targets and trends, it is useful to calculate the emissions intensity (Table 2). Emissions intensity has been calculated only in relation to departmental activities as non-departmental emissions are not directly impacted by changes in departmental operating funding and number of staff.
Table 2: Emissions intensity by FTE staff and expenditure
|
|
|
|
|
2023 |
|---|---|---|---|---|
|
Gross emissions (tCO2e) – Departmental |
6,001 |
|||
|
Key performance indicator |
|
|||
|
FTE staff [ 1 ] |
2,644 |
|||
|
Operating expenditure ($m) |
661.908 |
|||
|
Emissions intensity |
|
|||
|
Total emissions per FTE (tCO2e) |
2.27 |
|||
|
Total emissions per million dollars of expenditure (tCO2e) |
|
|
9.07 |
|
Note 1 – FTE staff includes permanent, fixed-term and events-based employees (refer to Appendix B).
Verification of our emissions measurement
Our GHG emissions measurement (emissions data and calculations) has been independently verified against ISO 14064-1:2018 by Toitū Envirocare (Enviro-Mark Solutions Limited), a wholly owned subsidiary of Manaaki Whenua – Landcare Research, which is a Government-owned Crown Research Institute. However, it should be noted that quantifying GHG emissions is subject to uncertainty, as the methodologies to determine the emissions factors and processes to calculate or estimate quantities of GHG sources are still evolving.
Our emissions assumptions, calculations and reporting continue to be refined as part of our ongoing process improvements. Additional sources may be included in future emissions reporting as we identify and establish appropriate data collection processes.
Our emissions reduction targets
Following the change in base year, Te Tari Taiwhenua set revised gross emissions reduction targets that align to a 1.5 degree Celsius limit to global temperature rise. Emissions targets have been calculated against mandatory emissions only and exclude 826 tCO2e from staff commuting. Under these targets, Te Tari Taiwhenua will need to meet reductions in mandatory emissions from the base year of 12 percent and 42 percent by 2025 and 2030, respectively. This will require an average reduction in carbon emissions of 450 tCO2e per annum.
Figure 1: 2025 and 2030 targets compared to base year
2023")
Our emissions reduction plan
Te Tari Taiwhenua has an emissions reduction plan in place to progress toward these targets and ensure data capture continues to improve. We are currently in the process of updating this plan to include a more targeted, data-driven approach. It is important that we monitor our operational activities closely to ensure we meet the challenges of delivering our services while reducing overall carbon emissions.
The following emissions reduction initiatives were completed in 2022/23:
- Established a dedicated steering group to provide advice, recommendations and assurance to the Executive Leadership Team on the requirement for Te Tari Taiwhenua to reduce emissions and to drive the necessary policy and organisational changes. The steering group is supported by two working groups to first investigate and then monitor reduction initiatives, including possible changes to operating models and the supply chain.
- The Executive Leadership Team agreed to a 15 percent reduction in air travel budgets for 2023/24 (excluding Ministerial travel) with clear carbon emissions targets.
- Updated our travel policy to make business class air travel for international travel an exception requiring the Chief Executive’s approval.
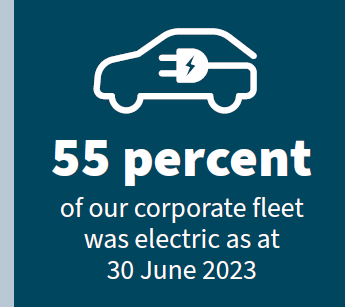
- Progressed the optimisation and electrification of our corporate fleet (excluding vehicles managed by VIP Transport Services) with an additional 31 electric vehicles (EVs) purchased in 2022/23. As at 30 June 2023, 55 percent of our corporate fleet was electric (3 percent at 30 June 2022).
- Progressed the replacement of end-of-life equipment with energy efficient systems (chillers, circuit breakers, cool stores, air handling units and cooling towers) at Archives New Zealand and the National Library of New Zealand.
- Replaced gas water heating system at the Avalon Film Archive.
- Installed sub-metering to monitor energy consumption at the National Library of New Zealand in Wellington.
- Completed a staff commuting survey and improved data capture.
- Improved internal reporting and communication of emissions activities to increase awareness and ensure environmental sustainability becomes part of our mahi.
Case study
Te Tari Taiwhenua Transition to Electric Vehicles (EVs) – A Sustainable Journey
Our aim
In December 2021, Te Tari Taiwhenua started a significant programme to transition its corporate fleet to EVs. We originally had 74 vehicles, all except one powered by an internal combustion engine.
Our role
 To kickstart the transition we commissioned a study, which highlighted that 39 percent of our fleet travelled fewer than 5,000 kilometres per year and also identified that 96 percent of the passenger fleet was suitable for EV transition. Auckland, Wellington and Christchurch emerged as the most suitable locations for EV adoption, given their low vehicle utilisation rates and the availability of EV infrastructure.
The study presented compelling findings that shaped our transition plan to achieve a 96 percent reduction in carbon emissions from our corporate fleet and an estimated annual fuel savings of $37,800.
We successfully applied for a grant under the State Sector Decarbonisation Fund, securing a subsidy of up to $30,000 per EV and $5,000 per charging station for a total of $1.467 million.
The transition initiative gained momentum in August 2022 when we deployed a pilot fleet of EVs in Palmerston North.
The outcome
As at 30 June 2023, 55 percent of our corporate fleet was electric, with 31 new EVs delivered across the country in 2022/23. EV charging stations have also been installed in 15 sites.
The roll-out is expected to complete in 2023/24 with the delivery of 11 additional EVs. At the end of the transition and optimisation programme, our corporate fleet would have reduced by 30 percent, from 74 to 52 vehicles, and be 87 percent EV. The full positive impact of the roll-out on carbon emissions is expected to be achieved in 2024/25.
What this means for New Zealanders
By using data-driven strategies and securing funding we successfully initiated a transition that delivers environmental benefits and cost savings, while keeping staff safety at the forefront.
