- IN THIS SECTION:
- Financial Summary
- Statement of Significant Accounting Policies
- Forecast Financial Performance
- Forecast Financial Position
- Forecast Cash Flows
- Reconciliation of Forecast Net Cash Flows
- Forecast Movement in Taxpayers' Funds
- Forecast Non-current Assets
- Forecast Capital Expenditure
- Forecast Financial Results
- Forecast Statement of Commitments
- Forecast Memorandum Accounts
- Forecast Financial Performance for each Output Expense
Part Five - Forecast Financial Statements
Financial Summary
RevenueThe Department of Internal Affairs expects to receive $200.054 million in revenue made up of:
|
ExpenditureThe Department expects to incur expenses of $200.343 million to deliver outputs under 18 Departmental output expenses across six Votes |
InvestmentThe Department expects to receive a capital injection from the Crown of $9.472 million in the 2007/08 financial year:
|
Financial Forecast
|
Budget (Supplementary Estimates) $000 |
2006/07 Estimated Actual $000 |
2007/08 Forecast (Main Estimates) $000 |
|
| Revenue Crown | 91,468 | 91,468 | 83,971 |
| Revenue Third Parties | 114,587 | 114,587 | 116,083 |
| Total Revenue | 206,055 | 206,055 | 200,054 |
| Less Total Expenses | 209,531 | 203,570 | 200,343 |
| Net Surplus/(Deficit) | (3,476) | 2,485 | (289) |
| Taxpayers' Funds* | 41,336 | 44,812 | 53,995 |
*(Crown's investment in the Department)
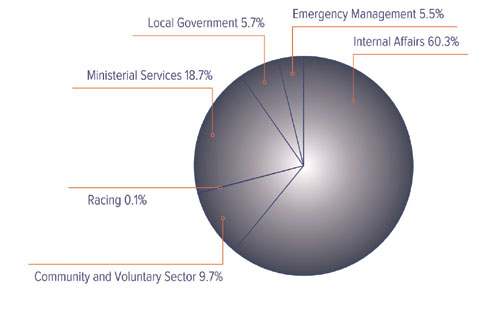
Percentage of Departmental Expense by Vote for 2007/08
Major Financial Changes
The main movements in revenue Crown between 2006/07 Supplementary Estimates ($91.468 million) and 2007/08 Main Estimates ($83.971 million) include:
- a decrease in funding of $1.312 million relating to the Commission of Inquiry into Police Conduct
- a decrease in funding of $635,000 relating to the Confidential Forum for Former In-Patients of Psychiatric Hospitals
- a decrease in funding of $1.527 million due to the upgrade of information and technology infrastructure
- a decrease in funding of $1.079 million relating to the Local Government Rating Inquiry
- a decrease in funding of $3.189 million for the Identity Verification Service
- a decrease in funding of $1.256 million for the 2007 Commonwealth Local Government Conference
- a decrease of funding of $500,000 for the Local Government Commission
- a decrease of funding of $500,000 to implement the work of the expert panel on war disablement pensions
- an increase of funding of $326,000 to provide for the ability to relocate to a secondary Emergency Operations Centre and the provision of computer-based information systems
- an increase of funding of $450,000 for the establishment and operation of an Enforcement Unit to monitor and enforce compliance with the Unsolicited Electronic Messages Act 2007
- an increase of funding of $600,000 to increase ethnic diversity leadership
- an increase of funding of $1.000 million to increase the security of identity related records
- an increase of funding of $165,000 to implement changes contained in the Births, Deaths, Marriages and Relationship Registration Amendment Bill.
Statement of Significant Accounting Policies
Reporting Entity
The Department of Internal Affairs' forecast financial statements have been prepared in accordance with section 38 of the Public Finance Act 1989. Section 2 of this Act defines the Department of Internal Affairs as a Government Department. For the purposes of financial reporting the Department of Internal Affairs of New Zealand is a public benefit entity.
Reporting Period
The reporting period for these forecast financial statements is the year ending 30 June 2008.
Estimates and Forecasts
Actual results for 2007/08 may vary from the information presented in the forecast financial statements. Any variation will generally be a result of fluctuations in the level of demand for products produced by the Department.
Statement of Compliance
These forecast financial statements have been prepared in accordance with New Zealand generally accepted accounting practice. They have been adapted to comply with New Zealand equivalents to International Financial Reporting Standards (NZ IFRS) and other applicable Financial Reporting Standards, as appropriate for public benefit entities. These are the Department of Internal Affairs' first consolidated forecast financial statements complying with NZ IFRS.
Accounting Policies
The accounting policies set out below have been applied consistently to all periods presented in these forecast financial statements.
The measurement base applied is that of historical cost, modified by revaluation of land, buildings, antiques and works of art.
The accrual basis of accounting has been used unless otherwise stated. These forecast financial statements are presented in New Zealand dollars rounded to the nearest thousand.
Judgements and Estimations
The preparation of forecast financial statements in conformity with NZ IFRS requires judgements, estimates and assumptions that affect the application of policies and reported amounts of assets and liabilities, income and expenses. The estimates and associated assumptions are based on historical experience and various other factors that are believed to be reasonable under the circumstances. Actual results may differ from these estimates.
The estimates and underlying assumptions are reviewed on an ongoing basis. Revisions to accounting estimates are recognised in the period in which the estimate is revised if the revision affects only that period, or in the period of the revision and future periods if the revision affects both current and future periods.
Cost Allocation
The methods used in the allocation of costs are consistent between projected (budgeted) and actual figures. Costs of outputs are derived using the following cost allocation system:
"Direct Costs" are those costs directly attributed to an output and are treated as follows.
- Personnel costs are allocated on the basis of estimated time engaged in the delivery of a particular output.
- Operating costs are allocated on the basis of usage.
- Depreciation and capital charge are allocated on the basis of estimated asset utilisation.
- Accommodation costs are allocated on the basis of floor space occupied.
"Indirect Costs" are those costs incurred by support units that are not directly attributable to an output.
- Indirect costs are allocated to outputs on an activity-costing basis reflecting a mix of perceived benefit, personnel numbers, floor space and estimated allocation of time.
Taxation
The Department is exempt from the payment of income tax in terms of the Income Tax Act 2004. Accordingly, no charge for income tax has been provided. The Department is subject to fringe benefit tax (FBT), and goods and services tax (GST). It administers pay as you earn tax (PAYE).
Goods and Services Tax (GST)
Amounts in the Forecast Financial Statements are reported exclusive of GST except for accounts receivable, prepayments and accounts payable.
The amount of GST owing to or from Inland Revenue at balance date is included in the Statement of Forecast Financial Position as a receivable or payable (as appropriate).
Revenue
Crown Revenue
The Department derives revenue for the provision of outputs (services) to the Crown. Crown Revenue is recognised at balance date over the specified period for each service.
Third Party Revenue
The Department derives revenue from third parties for the provision of outputs (products or services) to third parties. Revenue from the supply of goods and services is measured at the fair value of consideration received. Revenue from the supply of goods is recognised when the significant risks and rewards of ownership have been transferred to the buyer unless an alternative method better represents the stage of completion of the transaction. Such revenue is recognised when earned and is reported in the financial period to which it relates.
Expenses
Expenses are recognised and reported in the Statement of Forecast Financial Performance in the period in which the service is provided or the goods are received.
Foreign Currency
Transactions in foreign currencies are initially translated at the foreign exchange rate at the date of the transaction.
Monetary assets denominated in foreign currencies at balance date are translated to New Zealand dollars at the foreign exchange rate at balance date. Foreign exchange gains or losses arising from translation of monetary assets are recognised in the Statement of Forecast Financial Performance.
Financial Instruments
Designation of financial assets and financial liabilities is determined by the business purpose of the financial instruments, policies and practices for their management, their relationship with other instruments and the reporting costs and benefits associated with each designation.
Financial Assets
Cash and cash equivalents include cash on hand, cash in transit, and bank accounts.
Accounts receivable have been designated as loans and receivables. Loans and receivables are non-derivative financial assets with fixed or determinable payments that are not quoted in an active market. Loans and receivables are recognised initially at fair value plus transaction costs and subsequently measured at amortised cost using the effective interest rate method. Loans and receivables entered into with a duration of less than 12 months are recognised at their nominal value. At each balance date, the Department assesses whether there is any objective evidence that loans and receivables are impaired. Any impairment losses are recognised in the Statement of Forecast Financial Performance as bad debts.
Financial Liabilities
Financial liabilities are recognised initially at fair value less transaction costs and subsequently measured at amortised cost using the effective interest rate method.
Financial liabilities entered into with duration less than 12 months are recognised at their nominal value.
Inventories
Inventories held for sale are recorded at the lower of cost (calculated using first in-first out method) and net realisable value. Inventories held for distribution are recorded at the lower of cost and current replacement cost.
Non-current Assets
Property, Plant and Equipment
Items of property, plant and equipment costing more than $3,000 are initially recorded at cost.
Revaluations are carried out for a number of classes of property, plant and equipment to reflect the service potential or economic benefit obtained through control of the assets. Revaluation is based on the fair value of the asset with changes reported by class of asset.
Land and buildings are recorded at fair value less impairment losses and, for buildings, less depreciation accumulated since the assets were last revalued. Valuations undertaken in accordance with the standards issued by the New Zealand Property Institute are used.
Antiques and works of art are recorded at fair value and are not depreciated.
Other property, plant and equipment, which includes motor vehicles and office equipment, are recorded at cost less accumulated depreciation and accumulated impairment losses.
Realised gains and losses arising from disposal of property, plant and equipment are recognised in the Statement of Forecast Financial Performance in the period in which the transaction occurs. Any balance attributable to the disposed asset in the asset revaluation reserve is transferred to retained earnings.
For each property, plant and equipment asset project, borrowing costs incurred during the period required to complete and prepare the asset for its intended use are recognised as expenses.
The carrying amounts of property, plant and equipment are reviewed at least annually to determine if there is any indication of impairment. Where an asset's recoverable amount is less than its carrying amount, the asset will be reported at its recoverable amount and an impairment loss will be recognised. Losses resulting from impairment are reported in the Statement of Forecast Financial Performance, unless the asset is carried at a revalued amount in which case any impairment loss is treated as a revaluation decrease.
Intangible Assets
Intangible assets are initially recorded at cost. The cost of an internally generated intangible asset represents expenditure incurred in the development phase of the asset only. The development phase occurs after the following can be demonstrated: technical feasibility; ability to complete the asset; intention and ability to sell or use; and development expenditure can be reliably measured. Expenditure incurred on research of an internally generated intangible asset is expensed when it is incurred. Where the research phase cannot be distinguished from the development phase, the expenditure is expensed when it is incurred.
Intangible assets with finite lives are subsequently recorded at cost, less any amortisation and impairment losses. Amortisation is charged to the Statement of Forecast Financial Performance on a straight-line basis over the useful life of the asset. Typically, the estimated useful lives of these intangible assets (software) is 3 - 5 years.
Realised gains and losses arising from disposal of intangible assets are recognised in the Statement of Forecast Financial Performance in the period in which the transaction occurs. Unrealised gains and losses arising from changes in the value of intangible assets are recognised at balance date. To the extent that a gain reverses a loss previously charged to the Statement of Forecast Financial Performance, the gain is credited to the Statement of Forecast Financial Performance. Otherwise, gains are credited to an asset revaluation reserve for that asset. To the extent that there is a balance in the asset revaluation reserve for the intangible asset, a revaluation loss is debited to the reserve. Otherwise, losses are reported in the Statement of Forecast Financial Performance.
Depreciation
Depreciation is charged on a straight-line basis at rates calculated to allocate the cost or valuation of an item of property, plant and equipment, less any estimated residual value, over an asset's estimated useful life. The estimated useful lives are as follows:
|
Buildings |
15 - 66 Years |
|
Plant and Equipment |
5 - 20 Years |
|
Furniture and Fittings |
5 - 10 Years |
|
Office Equipment |
5 - 10 Years |
|
Motor Vehicles |
4 - 6 Years |
|
IT Equipment |
3 - 5 Years |
|
Births, Deaths and Marriages |
10 Years |
Finance Leases
Finance leases transfer to the Department, as lessee, substantially all the risks and rewards incident on the ownership of a leased asset. Initial recognition of a finance lease results in an asset and liability being recognised at amounts equal to the lower of the fair value of the leased property, or the present value of the minimum lease payments. The capitalised values are amortised over the period in which the Department expects to receive benefits from their use. Office equipment leases are recognised as finance leases.
Operating Leases
Operating leases, where the lessor substantially retains the risks and rewards of ownership, are recognised in a systematic manner over the term of the lease. Accommodation and motor vehicle leases are recognised as operating leases.
Leasehold improvements are capitalised and the cost is amortised over the unexpired period of the lease, or the estimated useful life of the improvements, whichever is shorter. Lease incentives received are recognised evenly over the term of the lease as a reduction in rental expense.
Employee Entitlements
Employee entitlements to salaries and wages, annual leave, long service leave, retiring leave and other similar benefits are recognised in the Statement of Forecast Financial Performance when they accrue to employees. Employee entitlements to be settled within 12 months are reported at the amount expected to be paid. The liability for long-term employee entitlements is reported as the present value of the estimated future cash outflows.
Termination Benefits
Termination benefits are recognised in the Statement of Forecast Financial Performance only when there is a demonstrable commitment to either terminate employment prior to normal retirement date or to provide such benefits as a result of an offer to encourage voluntary redundancy. Termination benefits settled within 12 months are reported at the amount expected to be paid, otherwise they are reported as the present value of the estimated future cash outflows.
Other Liabilities and Provisions
Other liabilities and provisions are recorded at the best estimate of the expenditure required to settle the obligation. Liabilities and provisions to be settled beyond 12 months are recorded at their present value.
Changes in Accounting Policies
Accounting policies are changed only if the change is required by a standard, an interpretation or when more reliable and relevant information can be provided.
These forecast financial statements have been adapted to comply with NZ IFRS.
Forecast Financial Performance
Statement of Forecast Financial Performance
for the year ending 30 June 2008
|
2006/07
Budget (Supplementary Estimates) $000 |
2006/07
Estimated Actual $000 |
2007/08
Forecast (Main Estimates) $000 |
Revenue |
| Crown | 91,468 | 91,468 | 83,971 |
| Department | 10,685 | 10,685 | 10,582 |
| Other | 103,902 | 103,902 | 105,501 |
| Total Revenue | 206,055 | 206,055 | 200,054 |
| Expenses | |||
| Personnel | 108,392 | 105,742 | 104,738 |
| Operating | 89,718 | 86,407 | 81,430 |
| Depreciation and Amortisation | 8,099 | 8,099 | 10,475 |
| Capital Charge | 3,322 | 3,322 | 3,700 |
| Total Output Expenses | 209,531 | 203,570 | 200,343 |
| Net Surplus/(Deficit) | (3,476) | 2,485 | (289) |
Forecast Financial Position
Statement of Forecast Financial Position
as at 30 June 2008
|
2006/07
Budget (Supplementary Estimates) $000 |
2006/07
Estimated Actual $000 |
2007/08
Forecast (Main Estimates) $000 |
|
| Assets | |||
| Current Assets | |||
| Cash and Bank Balances | 26,675 | 32,562 | 32,241 |
| Prepayments | 36 | 36 | 57 |
| Inventories | 1,975 | 1,975 | 2,053 |
| Accounts Receivable | 5,722 | 5,722 | 5,371 |
| Total Current Assets | 34,408 | 40,295 | 39,722 |
| Non-current Assets | |||
| Property, Plant and Equipment | 26,109 | 26,109 | 29,174 |
| Intangible Assets | 10,721 | 10,721 | 15,095 |
| Total Non-current Assets | 36,830 | 36,830 | 44,269 |
| Total Assets | 71,238 | 77,125 | 83,991 |
|
|||
| Liabilities | |||
| Current Liabilities | |||
| Accounts Payable | 6,971 | 6,971 | 7,838 |
| Provisions | 1,169 | 1,169 | 1,169 |
| Provision for Payment of Surplus | 0 | 2,485 | 0 |
| Accrued Expenses | 11,285 | 11,211 | 11,536 |
| Revenue Received in Advance | 9,583 | 9,583 | 8,555 |
| Total Current Liabilities | 29,008 | 31,419 | 29,098 |
| Term Liabilities | |||
| Employee Entitlements | 894 | 894 | 898 |
| Total Term Liabilities | 894 | 894 | 898 |
| Total Liabilities | 29,902 | 32,313 | 29,996 |
| Taxpayers' Funds | |||
| General Funds | 39,680 | 43,156 | 52,339 |
| Revaluation Reserve | 1,656 | 1,656 | 1,656 |
| Total Taxpayers' Funds | 41,336 | 44,812 | 53,995 |
| Total Liabilities and Taxpayer Funds | 71,238 | 77,125 | 83,991 |
Forecast Cash Flows
Statement of Forecast Cash Flows
for the year ending 30 June 2008
Reconciliation of Forecast Net Cash Flows
Reconciliation of Forecast Net Cash Flows
from operating activities to net surplus/(deficit) in the Statement of Forecast Financial Performance for the year ending 30 June 2008
|
2006/07
Budget (Supplementary Estimates) $000 |
2006/07
Estimated Actual $000 |
2007/08
Forecast (Main Estimates) $000 |
|
| Surplus/(Deficit) from Statement of Financial Performance | (3,476) | 2,485 | (289) |
| Add Non-cash items | |||
| Depreciation | 8,099 | 8,099 | 10,475 |
| Movements in Working Capital items | |||
| (Increase)/Decrease in Accounts Receivable | (1,776) | (1,776) | 351 |
| (Increase)/Decrease in Prepayments | 63 | 63 | (21) |
| (Increase)/Decrease in Inventories | 698 | 698 | (78) |
| Increase/(Decrease) in Accounts Payable | (2,828) | (2,828) | 867 |
| Increase/(Decrease) in Accrued Expenses | 228 | 228 | (55) |
| Increase/(Decrease) in Revenue Received in Advance | (3,537) | (3,537) | (3,513) |
| Increase/(Decrease) in Employee Entitlements | 291 | 217 | 384 |
| Non-operating Items included above | |||
| Increase/(Decrease) in Accounts Payable for Property, Plant and Equipment | 15 | 15 | 0 |
| Net Cash Flows from Operating Activities | (2,223) | 3,664 | 8,121 |
Forecast Movement in Taxpayers' Funds
Statement of Forecast Movement in Taxpayers' Funds (Equity)
for the year ending 30 June 2008
|
2006/07
Budget (Supplementary Estimates) $000 |
2006/07
Estimated Actual $000 |
2007/08
Forecast (Main Estimates) $000 |
|
| Net Surplus/(Deficit) for the Year | (3,476) | 2,485 | (289) |
| Total Recognised Revenue and Expenses | (3,476) | 2,485 | (289) |
| Capital Injection | 520 | 520 | 9,472 |
| Provision for Payment of Surplus | 0 | (2,485) | 0 |
| Movement in Taxpayers' Funds for the year | (2,956) | 520 | 9,183 |
| Taxpayers' Funds as at 1 July | 44,292 | 44,292 | 44,812 |
| Taxpayers' Funds as at 30 June | 41,336 | 44,812 | 53,995 |
Forecast Non-current Assets
Statement of Forecast Non-Current Assets
by category for the year ending 30 June 2008
|
Estimated Actual 30 June 2007 |
Forecast 30 June 2008 |
|||||
| Cost or Valuation $000 | Accumulated Depreciation $000 | Carrying Amount $000 | Cost or Valuation $000 | Accumulated Depreciation $000 | Carrying Amount $000 | |
| Land | 4,765 | 0 | 4,765 | 4,145 | 0 | 4,145 |
| Buildings | 3,422 | 104 | 3,318 | 2,872 | 173 | 2,699 |
| Building Alterations | 7,544 | 3,227 | 4,317 | 8,689 | 4,752 | 3,937 |
| Antiquities and Works of Art | 416 | 0 | 416 | 416 | 0 | 416 |
| Furniture and Fittings | 542 | 349 | 193 | 557 | 392 | 165 |
| Office Equipment | 1,288 | 650 | 638 | 1,317 | 876 | 441 |
| Plant and Equipment | 1,136 | 693 | 443 | 4,211 | 807 | 3,404 |
| Information Technology Hardware | 15,194 | 6,060 | 9,134 | 19,653 | 8,518 | 11,135 |
| Information Technology Software (Intangible Assets) | 22,522 | 11,801 | 10,721 | 31,250 | 16,155 | 15,095 |
| Leased Equipment | 351 | 351 | 0 | 351 | 351 | 0 |
| Motor Vehicles | 4,231 | 1,346 | 2,885 | 4,198 | 1,366 | 2,832 |
| Total Non-current Assets | 61,411 | 24,581 | 36,830 | 77,659 | 33,390 | 44,269 |
Forecast Capital Expenditure
Forecast Capital Expenditure Summary
for the period 2002/03 to 2007/08
|
2002/03
Actual $000 |
2003/04
Actual $000 |
2004/05
Actual $000 |
2005/06
Actual $000 |
2006/07
Estimated Actual $000 |
2007/08
Forecast (Main Estimates) $000 |
|
| Building and Alterations | 1,707 | 1,217 | 312 | 2,829 | 1,767 | 1,800 |
| Information Technology Hardware | 20 | 108 | 963 | 870 | 3,142 | 1,283 |
| Information Technology Software | 2,599 | 5,706 | 4,660 | 5,375 | 7,463 | 13,789 |
| Motor Vehicles | 875 | 1,677 | 691 | 1,797 | 1,480 | 1,231 |
| Plant and Equipment | 37 | 254 | 163 | 468 | 617 | 2,211 |
| Total Capital Expenditure | 5,238 | 8,962 | 6,789 | 11,339 | 14,469 | 20,314 |
The majority of capital expenditure forecast for 2007/08 is for the upgrade and development of information systems, databases and infrastructural information technology systems to enable the Department to provide quality information in an efficient manner and therefore aid in the production of efficient and effective services and quality policy advice.
Forecast Financial Results
Forecast Financial Results for the Department
for the year ending 30 June 2008
| Unit |
2006/07
Budget (Supplementary Estimates) |
2006/07
Estimated Actual |
2007/08
Forecast (Main Estimates) |
|
| Operating Results | ||||
| Revenue: Other | $000 | 103,902 | 103,902 | 105,501 |
| Revenue: Department | $000 | 10,685 | 10,685 | 10,582 |
| Total Expenses | $000 | 209,531 | 203,570 | 200,343 |
| Operating Surplus before Capital Charge | $000 | (154) | 5,807 | 3,411 |
| Net Surplus/(Deficit) | $000 | (3,476) | 2,485 | (289) |
| Working Capital | ||||
| Liquid Ratio | 0.92:1 | 1.04:1 | 1.11:1 | |
| Current Ratio | 1.19:1 | 1.28:1 | 1.37:1 | |
| Average Debtors Outstanding | Days | 15 | 15 | 17 |
| Average Creditors Outstanding | Days | 35 | 37 | 33 |
| Resource Utilisation | ||||
| Property, Plant and Equipment | ||||
| Property, Plant and Equipment as % of Total Assets | % | 37 | 34 | 35 |
| Additions as % of Property, Plant and Equipment | % | 55 | 55 | 70 |
| Taxpayers' Funds | ||||
| Level at Year-end | $000 | 41,336 | 44,812 | 53,995 |
|
||||
| Forecast Net Cash Flows | ||||
| Surplus/ (Deficit) from Operating Activities | $000 | (2,223) | 3,664 | 8,121 |
| Deficit from Investing Activities | $000 | (12,774) | (12,774) | (17,914) |
| Surplus/ (Deficit) from Financing Activities | $000 | (2,185) | (2,185) | 9,472 |
| Net Increase/(Decrease) in Cash Held | $000 | (17,182) | (11,295) | (321) |
Forecast Statement of Commitments
Forecast Statement of Commitments
as at 30 June 2008
|
2006/07 Estimated Actual $000 |
2007/08 Forecast (Main Estimates) $000 |
|
| OPERATING COMMITMENTS | ||
| Non-Cancellable Accommodation Leases | ||
| Less than one year | 6,434 | 2,594 |
| One to two years | 2,585 | 2,302 |
| Two to five years | 4,636 | 2,888 |
| Over five years | 961 | 408 |
| Total Accommodation Commitments | 14,616 | 8,192 |
| Other Non-Cancellable Leases | ||
| Less than one year | 671 | 223 |
| One to two years | 134 | 18 |
| Two to five years | 17 | 2 |
| Total Other Lease Commitments | 822 | 243 |
|
||
| Non-Cancellable Contracts for the Supply of Goods and Services | ||
| Less than one year | 892 | 892 |
| Total Supply Commitments | 892 | 892 |
| Total Commitments | 16,330 | 9,327 |
Forecast Memorandum Accounts
Forecast of the Memorandum Accounts
for the year ending 30 June 2008
Memorandum accounts are notional accounts to record the accumulated balance of surpluses and deficits for outputs funded by fees charged to third parties. They are intended to provide a long-run perspective to the pricing of outputs.
|
Forecast
Closing Balance 30/06/2007 $000 |
Forecast
Movement During 2007/08 $000 |
Forecast
Closing Balance 30/06/2008 $000 |
|
| New Zealand Gazette | (86) | 1 | (85) |
|
Use of facilities and access
to Lake Taupo by boat users |
66 | (1) | 65 |
| Passport products | 447 | - | 447 |
| Citizenship products | (1,144) | (468) | (1,612) |
| Marriage products | 836 | (105) | 731 |
|
Issue of birth, death and marriage
certifications and other products |
2,515 | 186 | 2,701 |
| Administration of non-casino gaming | (6,715) | 176 | (6,539) |
This statement is to be read in conjunction with the Statement of Significant Accounting Policies. The memorandum accounts were established on 30 June 2002.
Action Taken to Address Surpluses and Deficits
New Zealand Gazette
The cost of publishing and distributing the New Zealand Gazette is recovered through third party fees. A surplus generated in any year is to be offset against deficits in future years. Fees will be reviewed to reduce the accumulated deficit.
Use of Facilities and Access to Lake Taupo by Boat Users
The Department of Internal Affairs manages marina berths, jetties and boat ramps located about Lake Taupo. Fees are charged to third parties who use marina berths and boat ramps. Fee income is applied to recover the maintenance and administration cost of these facilities. Operating surpluses in any year will be applied in the subsequent financial year to offset maintenance that may have been deferred due to unfavourable climatic or lake conditions.
Passport Products
The purpose of this account is to support a strategy to stabilise fees based on full cost recovery over a 4 to 5 year planning horizon. This strategy supports the introduction of new technologies including the replacement of the ageing passport system within that timeframe. The current fees schedule was introduced on 4 November 2005.
Citizenship Products
The purpose of this account is to support a strategy to stabilise fees based on full cost recovery over a 4 to 5 year planning horizon. The accumulated forecast deficit in this account reflects the period of time that citizenship fees were not based on full cost recovery and when volumes were lower than those used for pricing purposes. The current fees schedule was introduced on 1 September 2003 based on full cost recovery. The forecast deficit in this account will be examined in the next pricing review.
Marriage Products
The purpose of this account is to support a strategy to stabilise fees based on full cost recovery over a 4 to 5 year planning horizon. The small accumulated surplus is expected to reduce gradually over the next 3 years.
Birth, Death and Marriage Certificates, and other products
The purpose of this account is to support a strategy to stabilise fees based on full cost recovery over a 4 to 5 year planning horizon. The forecast accumulated surplus in this account will be examined in the next pricing review. The fees schedule for birth, death and marriage products was introduced on 1 September 2003 based on full cost recovery. The forecast surplus in this account reflects volume increases over levels assumed for pricing purposes.
Administration of Non-casino Gaming
Fees established to recover the cost of administration and regulation of non-casino gaming are reflected in specific licence fees for differing types of gaming activity and the registration of gaming machines. The fees schedule was introduced as part of the implementation of the Gambling Act 2003 with effect from 1 July 2004.. The next pricing review will occur in 2007/08.
Forecast Financial Performance for each Output Expense
Forecast Financial Performance for Each Output Expense
for the year ending 30 June 2008
| Departmental Output Expense |
Revenue
Crown $000 |
Revenue
Depts $000 |
Revenue
Other $000 |
Total
Expenses $000 |
Surplus/
(Deficit) $000 |
| Vote Community and Voluntary Sector | |||||
| Community and Voluntary Sector Services* | |||||
| - Administration of Grants | 4,372 | 197 | 7,743 | 12,311 | 1 |
| - Community Advisory Services | 5,272 | 117 | 9 | 5,398 | 0 |
| - Policy Advice - Community | 1,674 | 24 | 0 | 1,699 | (1) |
| Vote Emergency Management | |||||
| Emergency Management Services* | |||||
| - Management of National Emergency Readiness, Response and Recovery | 3,732 | 0 | 0 | 3,755 | (23) |
| - Policy Advice - Emergency Management | 860 | 21 | 0 | 860 | 21 |
| - Support Services, Information and Education | 6,440 | 47 | 0 | 6,488 | (1) |
| Vote Internal Affairs | |||||
| Gaming and Censorship Regulatory Services | 2,847 | 239 | 20,947 | 23,908 | 125 |
| Identity Services | 9,573 | 1,096 | 74,422 | 85,479 | (388) |
| Policy and Advisory Services* | |||||
| - Information and Advisory Services | 232 | 292 | 947 | 1,470 | 1 |
| - Policy Advice - Internal Affairs | 4,890 | 90 | 0 | 4,980 | 0 |
| Services Relating to Ethnic Affairs | 3,299 | 704 | 0 | 4,003 | 0 |
| Contestable Services | 0 | 88 | 811 | 899 | 0 |
|
|||||
| Vote Local Government | |||||
| Services for Local Government* | |||||
| - Information, Support and Regulatory Services | 4,575 | 91 | 562 | 5,248 | (20) |
| - Policy Advice - Local Government | 6,196 | 69 | 0 | 6,267 | (2) |
| Vote Ministerial Services | |||||
| Support Services to Ministers | 26,368 | 318 | 35 | 26,721 | 0 |
| VIP Transport | 0 | 7,173 | 20 | 7,193 | 0 |
| Visits and Official Events Coordination | 3,424 | 12 | 5 | 3,442 | (1) |
| Vote Racing | |||||
| Policy Advice - Racing | 217 | 4 | 0 | 222 | (1) |
| TOTAL DEPARTMENT | 83,971 | 10,582 | 105,501 | 200,343 | (289) |
*These are multi-class output appropriations
[ Previous | Next ]
Back to the Top