Resource material › Corporate Publications › Annual Report 2011-12Pūrongo ā Tau
Part A: Contribution to Outcomes and Objectives
On this page
- Our outcomes and objectives
- Contributing to outcomes
- Contributing to objectives
- Building Organisational Health and Capability
This section outlines how our work over the past year has contributed to the Department’s outcomes, objectives and intended results.
Our outcomes and objectives
The long-term outcomes and objectives[1] we are seeking to achieve for New Zealanders are:
Outcomes
- New Zealand’s diverse people and communities/hapū/iwi are resilient and prosperous
- New Zealand is recognised for creating, sharing and using knowledge for social, cultural and economic wellbeing
- The people of New Zealand have a strong and valued national identity, culture and heritage
Objective
- To enhance trust in government and confidence in the performance of public sector organisations
Our full outcomes framework is provided in Appendix I, including the links between:
- outcomes, intermediate outcomes and impacts
- objectives, lead objectives and supporting objectives.
In this Annual Report our contribution to outcomes and objectives, and our progress as measured against the indicators in our Statement of Intent, is reported under each of our impact and lead objective areas.
Measuring progress towards outcomes and objectives
During 2011/12 we began reviewing and improving performance measurement across the Department, to better reflect the changing nature and scope of our work and drive continuous improvement. This builds on the establishment of a new outcomes framework for the integrated Department from 1 February 2011.
This work is ongoing and includes improving impact, outcome and objective indicators. For the purposes of transparency, we have reported on both the indicators included in our 2011–14 Statement of Intent and the updated indicators developed during the year.
The most direct measure of our performance is how successfully we are delivering our outputs. Our output measures will also be reviewed as part of the performance measurement project.
Performance data for 2011/12 output measures is provided in Part B (Statements of Service Performance). Our financial performance is reported in Part C.
Contributing to outcomes
The following section reports on our contribution to achieving outcomes and our progress on the priorities, initiatives and indicators outlined in our Statement of Intent.
We contributed to our outcomes through the following impacts:
- People and communities understand and manage hazards and risks
- Participants in regulated activities behave responsibly and with integrity
- People have the capability to participate in their communities and across communities
- People are able to access and use information important to their lives
- New Zealand’s documentary record is protected and available for current and future generations
- New Zealand’s personal identity information has integrity
Outcome indicators
We used the indicators below to track progress towards our outcomes.
| Outcomes | Indicators | Trend | Data source |
|---|---|---|---|
| New Zealand’s diverse people and communities/hapū/iwi are resilient and prosperous | Increasing the proportion of people who feel a strong sense of community: | ||
People who feel a sense of community in their local neighbourhood |
2010: 60% 2008: 58.4% 2006: 59% |
Quality of Life Survey2 | |
People who feel isolated from others (some or most of the time) |
2010: 15% 2008: 16% |
General Social Survey (Statistics New Zealand) | |
| Increasing the proportion of people participating in civic society: | |||
The number of candidates standing for local authority elections |
2010: 3,917 2007: 4,123 2004: 4,092 |
Local Authority Election Statistics | |
Voter turnout at local authority elections |
2010: 49% 2007: 44% 2004: 46% |
Local Authority Election Statistics | |
The percentage of people who would like to have more of a say in what their council does |
2010: 46% 2008: 48% 2006: 52% |
Quality of Life Survey3 | |
| New Zealand is recognised for creating, sharing and using knowledge for social, cultural and economic wellbeing | Increasing New Zealand’s readiness to use and leverage ICT to increase wellbeing | Network Readiness Index ranking: 2012: 14 (of 142 countries) 2011: 18 (of 138) 2010: 19 (of 133) 2009: 22 (of 134) |
Global Information Technology Report (World Economic Forum and European Institute of Administration) |
| The people of New Zealand have a strong and valued national identity, culture and heritage | Maintaining a high proportion of people who say they belong to New Zealand | 2010: 94.5% 2008: 93.9% |
General Social Survey (Statistics New Zealand) |
| Maintaining a high proportion of people who say it is easy to express their own culture | Easy/very easy: 2010: 83.7% 2008: 82.3% Sometimes easy, sometimes difficult: 2010: 13.4% 2008: 13.9% |
General Social Survey (Statistics New Zealand) | |
| Maintaining the number of countries allowing visa-free access to New Zealand passport holders | 2010/11: 50+ 2009/10: 50+ |
Henley Visa Restrictions Index Global Ranking 2011 | |
Although our work makes an important contribution to outcomes, indicators are influenced by environmental factors beyond the impact of the Department’s activities and services. Due to the high-level and long-term nature of outcome indicators, some data sources are not conducted on an annual basis. We have reported on the most up-to-date data available.
Impact: People and communities understand and manage hazards and risks
We improved New Zealand’s resilience by increasing the capability to manage civil defence emergencies and protecting people from harm in social activities. This work contributed to our outcome for resilient and prosperous communities.
We contributed to Ministerial priorities in the following portfolios:
- Civil Defence
- Internal Affairs
- Local Government
- Community and Voluntary Sector
Contributing to the recovery from the Canterbury earthquakes
Maintaining services to the people of Canterbury in the aftermath of the earthquakes, and supporting our staff during the recovery, remained a priority during 2011/12. We continued to deliver a range of services from locations in Christchurch, including identity, regulatory, archives, library, and community and ethnic advisory services.
We responded to challenges and ongoing disruption to systems and accommodation by developing new ways of working to both continue and improve services.
This included developing shared service delivery initiatives and co-locating services with other agencies within Christchurch, to better coordinate our responses to the needs of communities in the area. For example, we based identity services staff with Inland Revenue in the city, making it easier for customers to access often complementary services and better share information between the two agencies.
Our Community Operations office minimised the effects of disruptions to infrastructure by moving all community funding applications and assessments in the region online, maintaining access to this funding to assist the recovery. We co-located our staff with Family and Community Services and Child, Youth and Family to better coordinate funding options and advice to people in Canterbury.
We worked with the Canterbury Earthquake Recovery Authority (CERA) and other agencies to support the recovery of local councils in the region. This included streamlining planning, reporting and rating processes to recognise the impact of ongoing uncertainty on meeting statutory deadlines, and assessing over $160 million in claims to reimburse the Christchurch City Council’s costs in responding to the earthquakes.[4] These were the largest and most complex civil defence claims the Department has ever processed.
During the year we supported the Christchurch Earthquake Appeal Trust to distribute funds to support communities in Canterbury. By 30 June 2012 the Trust had assessed and processed over $38 million of more than $74 million pledged to support earthquake recovery initiatives, community infrastructure and services.
We also continued to support the Royal Commission of Inquiry into Building Failure caused by the Canterbury Earthquakes.
The ways organisations in Christchurch have worked together to find innovative means of meeting new needs provides an insight into how public services can be transformed through better collaboration. We are identifying ways to replicate these examples elsewhere in our work, such as extending co-location arrangements and expanding the paperless office approach.
Learning from our response to the Canterbury earthquakes
Within the Department, the Ministry of Civil Defence and Emergency Management (MCDEM) coordinates the response to national civil defence emergencies and was the lead agency in responding to the Canterbury earthquakes. We commissioned an independent review into this response to identify any improvements needed in New Zealand’s civil defence emergency management framework. The review was completed in June 2012.
Recommendations will be assessed and incorporated into the national guidance we provide to regional Civil Defence Emergency Management Groups across the country. During the year we began updating our guidance with lessons learned from the Canterbury experience, including reviewing the provision of welfare services in emergencies, developing guidance for the rapid evaluation of dangerous buildings and enhancing business continuity planning.
The results of the review and the experience of our response will also inform the update of the National Civil Defence Emergency Management Plan[5] and a review of the Civil Defence Emergency Management Act 2002. This includes looking at whether legislative change is needed to strengthen the statutory framework for recovery from major civil defence events.
Volunteers were a crucial part of the response in Canterbury. We began developing ways to better harness and work with volunteering organisations and spontaneous volunteers in emergency response. MCDEM hosted a forum for volunteers to discuss their experience directly with central agencies and local government. The forum was attended by both the Minister of Civil Defence and Minister for the Community and Voluntary Sector.
Building awareness of risks and preparedness for emergencies
Through MCDEM we engage directly with New Zealanders to build community resilience and capability to manage through emergencies. We updated our school education programme (What’s the Plan, Stan?) and our media campaigns to build on the increasing awareness of the effects of hazards following the Canterbury earthquakes. During the year MCDEM began preparations for New Zealand ShakeOut, which will be the largest earthquake drill ever undertaken in New Zealand. By 30 June 2012 approximately 200,000 people had registered to take part in the exercise.
Awareness of advice on how to prepare for emergencies has increased significantly. The proportion of people taking steps to prepare has continued to steadily improve, with 75% of people who have seen Get Ready Get Thru advertising taking some action to be better prepared.[6] While overall preparedness measures were static over the last year, there has been a steady improvement since the start of the Get Ready Get Thru campaign, with over 30% of New Zealanders now prepared at home for emergencies, while the percentage of people who are fully prepared has more than doubled from the 2006 benchmark of 7%.[7]
New Zealanders prepared for emergencies
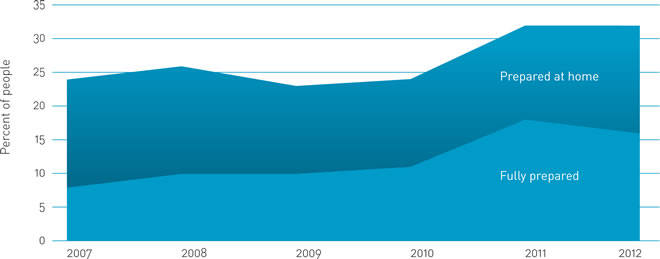
Source: Ministry of Civil Defence and Emergency Management Campaign Monitoring Research 2012
Larger version of image Long description
Preventing social harm through regulating activities
We regulate a range of activities including gambling, censorship, anti-money laundering, unsolicited electronic messages (spam), and private security work.
Our Regulatory Services group worked with the public, local authorities and national and international agencies to protect communities by minimising harmful social, economic and criminal behaviours.
We continued to reduce the negative impacts of gambling on communities and families by expanding the multi-venue exclusion programme (MVE). The MVE enables problem gamblers to exclude themselves in one process from multiple gambling venues in defined areas. Led by the Department and involving a number of other agencies, problem gambling services and health providers, the MVE now operates in 10 regions across the country. This is one of a number of mechanisms being used, and people have reported that it has given them information to make decisions to help minimise gambling.
With the increasing reach and accessibility of the Internet, it is an ongoing priority to develop new, collaborative ways to reduce risks and restrict illegal and harmful activity online.
Our Anti-Spam team improved connections with the ICT industry at national and international levels to improve cyber security, share information and develop advice for people and organisations to reduce the burden of spam. During the year we launched an innovative mobi[8] tool to make it easier for people to complain and take action against spam sent to mobile phones, and enabling anti-spam investigators to track text spam more efficiently.
A particular focus for the Department is reducing the online exploitation of children. We developed and implemented software to improve our detection of objectionable material, allowing us to work more closely with international agencies to prevent harm and prosecute offences.
Collaboration between our Censorship Unit and national and international law enforcement agencies resulted in arrests of individuals in a number of jurisdictions on charges related to child exploitation. Operation Laminar, initiated by the Department and undertaken in conjunction with Interpol and other agencies, resulted in 55 arrests in 20 countries for the production, possession and distribution of child sexual abuse and exploitation material on social networking sites. Twelve children were removed from harm, including one in New Zealand.
The Unit runs the Digital Child Exploitation Filter, which blocks New Zealanders from accessing unlawful websites known to offer objectionable content involving children. During the year we added eight Internet Service Providers (ISPs) to the programme, meaning most New Zealand ISPs, including all mobile phone data providers, are now involved.
The filter has been successful in reducing access to images of child sexual abuse over the Internet and blocking the worst sites from being accessed in New Zealand. Results of an independent survey by InternetNZ shows wide support for the use of the filter to reduce the harm associated with accessing images of abuse.[9]
| Indicators | Progress | Data source |
|---|---|---|
| Increasing the number of people prepared at home, work or both for civil defence emergencies: | ||
People prepared at home |
2011/12: 32% 2010/11: 32% 2009/10: 24% 2008/09: 23% |
Ministry of Civil Defence and Emergency Management Campaign Monitoring Research (Colmar Brunton) 2012[10] |
People prepared both at home and at work |
2011/12: 16% 2010/11: 18% 2009/10: 11% 2008/09: 10% |
|
| Increasing the number of people who are aware of ways to avoid gambling too much | 2010: 69.8% 2012 data will be available in late 2012 |
Health and Lifestyles Survey (Health Sponsorship Council) |
Impact: Participants in regulated activities behave responsibly and with integrity
We worked to minimise harmful and criminal behaviours, and maximise the community benefit from regulated activities. This work contributed to our outcomes for resilient and prosperous communities; and a New Zealand recognised for using knowledge for social, cultural and economic wellbeing.
We contributed to Ministerial priorities in the following portfolios:
- Internal Affairs
- Community and Voluntary Sector
Providing education and advice to encourage compliance
Our Regulatory Services group provides advice, education and guidance to encourage voluntary and sustained compliance in the sectors we regulate, and make it easy for people who want to comply with the law.
We actively engaged with operators and interested groups to discuss compliance issues and build an understanding of and commitment to obligations. This included holding regional forums with operators, attending and presenting to conferences, and regularly communicating issues online and through publications such as Gambits.
In 2011/12 we worked with relevant businesses to ensure they understand changes to regulatory responsibilities. We helped businesses prepare for the Anti-Money Laundering and Countering Financing of Terrorism Act (commencing in 2013) by publishing guidance, delivering road shows and working with the Reserve Bank and the Financial Markets Authority to develop standards for identity verification. A risk assessment and evaluation was undertaken across the private security sector to prepare for our regulatory responsibilities under the Private Security Personnel and Private Investigators Act 2010.
During the year we reviewed and clarified our approach to compliance, to ensure we keep pace with changes in our operating environment and regulatory practice. Being open and clear about the objectives of our regulatory work will provide regulated parties with greater certainty and understanding about our role and the compliance and enforcement responses they can expect from us. Our new approach will be implemented over the coming year, following consultation with the sector.
Enforcing regulations and deterring non-compliance
We use a range of regulatory tools to detect and deter non-compliance in the sectors we regulate. This includes maintaining our presence within these sectors through monitoring, auditing and intelligence gathering.
In 2011/12 we undertook more than 600 inspections, audits and investigations of gambling operations, and inspected over 2,000 outlets and responded to more than 600 complaints about potential breaches of censorship laws.
Our Anti-Spam unit fielded over 3,700 enquiries from the public during the year and investigated more than 4,000 New Zealand-linked complaints. This led to 93 official warnings, five civil infringement notices and one statement of claim in the High Court to reduce the disruption to legitimate business activity and the use of the Internet caused by spam.
Where necessary, we use a range of sanctions or enforcement options to protect communities from harmful and criminal behaviour.
Over the past year we increased the focus of enforcement activity on identifying and prosecuting serious, deliberate and harmful offending. We progressed more gambling prosecutions in 2011/12 than in any of the previous five years, with 25 cases going before the courts for serious breaches of the law. Through improved detection systems and processes we also increased the number of prosecutions for the possession or distribution of objectionable material.
Preparing for the transfer of the functions of the Charities Commission
The registration, education, monitoring and investigation functions of the Charities Commission transferred to the Department from 1 July 2012.
The transfer of these functions leverages the Department’s regulatory experience to deliver services to the charitable sector more cost-effectively. During the year we supported the State Services Commission with the passage of the Charities Amendment Act. This includes the establishment of an independent statutory board responsible for the registration and de-registration of charities. Appointments to the inaugural Charities Registration Board were completed in June 2012.
We also began working with Inland Revenue and Treasury to scope a review of the Charities Act and related tax issues, to enable more effective regulation in the charitable sector.
| Indicators | Progress | Data source |
|---|---|---|
| Number of breaches of relevant gambling regulations detected | 2011/12: 531 2010/11: 427 2009/10: 363 |
Internal Affairs data* |
| Number of official censorship-related warnings issued | 2011/12: 102 2010/11: 148 2009/10: 146 |
Internal Affairs data** |
| Number of censorship-related prosecutions initiated | 2011/12: 31 2010/11: 22 2009/10: 39 |
Internal Affairs data*** |
| The percentage of people receiving spam/nuisance emails | 2011: 73% 2009: 73% |
World Internet Project New Zealand 2011 |
- *
- The measure does not distinguish between changes due to increased monitoring by the Department or changes in the inherent compliance levels of the gambling sector. The Department is reviewing its compliance approach to focus on promoting compliance that minimises harm and maximises benefit. This may reveal future measures that can help distinguish between Department activity and sector compliance levels.
- **
- This change relates predominantly to selling of DVDs online. The Department spent time educating sellers of their requirements under the Films, Videos and Publications Classification Act 1993, hence the overall drop in numbers. We are seeing better compliance in terms of online selling of DVDs so this is an improved performance.
- ***
- Prosecutions relating to objectionable images have remained relatively static. However, the Department has conducted a compliance drive for DVD outlets in terms of their obligations under the Films, Videos, and Publications Classification Act 1993. Where appropriate, prosecutions have been initiated for non-compliance with labelling classification regulations. This drive has been taken with a view towards encouraging voluntary compliance by this component of the sector in the future.
Impact: People have the capability to participate in their communities and across communities
We supported and connected New Zealand’s diverse communities to increase participation in society and the economy. This work contributed to our outcomes for resilient and prosperous communities; and a New Zealand recognised for using knowledge for social, cultural and economic wellbeing.
We contributed to Ministerial priorities in the following portfolios:
- Internal Affairs
- Community and Voluntary Sector
- Ethnic Affairs
- Local Government
Providing support to empower and connect communities
Our network of frontline regional advisors works directly with community groups providing advice, information and resources to empower communities and support sustainable local development initiatives.
During the year we delivered community workshops and seminars to build capability to plan, fund and manage projects that strengthen social, economic and cultural wellbeing. We provided targeted advice to locally-led projects to help community organisations develop good governance and management practices.
We responded to changing demand for community services by reviewing the way we work and looking for better ways of meeting people’s needs into the future.
This included investing more strategically in communities by implementing five community-led development initiatives. These are trialling a long-term approach to Crown-funded schemes, allowing the government to invest in whole communities rather than isolated organisations and projects. We supported these communities to select local leadership groups and begin developing their community plans. The first evaluation of the benefits of these initiatives will be completed in 2012.
A priority during the year was strengthening support for the essential role of volunteering and philanthropy in civil society. We carried out a range of operational and policy activities including reprioritising funding to the Support for Volunteering Fund and building dialogue across government, community and private sector organisations about social enterprise and social finance. We began a project looking at government’s role in growing a culture of generosity, to increase and better support the number of New Zealanders who regularly volunteer and donate money.
The importance of strong community-government relationships to support the work of community organisations was reinforced by the signing of the Kia Tutahi Relationship Accord by the Prime Minister in August 2011. The Accord provides guiding principles for government and communities to work together to achieve social, economic and environmental outcomes. We established a reference group to oversee implementation of the Accord and Internal Affairs is one of seven champion agencies identifying examples of good practice in working with communities.
New Zealanders volunteering and donating money
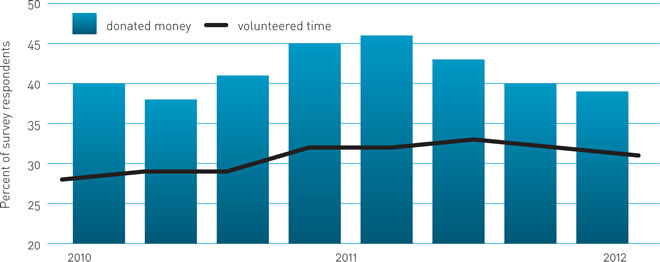
Source: Consumer & Media Insights Survey (Nielsen Media)
Larger version of image Long description
Supporting ethnic communities to participate and contribute to society
The Department’s Office of Ethnic Affairs is seeing increasing demand for services as New Zealand’s demographic make-up changes. We responded to 15,000 queries about ethnic issues in 2011/12, an increase of 23% from the previous year.
The Office continued to focus on increasing ethnic communities’ participation in New Zealand’s society and economy. We worked with other agencies, local authorities and the private sector to deliver the EPIC NZ[11] conference, tailored business knowledge workshops and regional visits to investigate investment opportunities. These initiatives develop business connections and make use of migrant community networks to maximise the potential for ethnic communities to contribute to economic growth.
To support these connections we developed the EPIC NZ website, providing ethnic communities with essential information for doing business in New Zealand and a business-matching database which has attracted over 180 registrations.
We continued to work with ethnic communities to maintain New Zealand’s reputation for social harmony. The Office delivered the EthnicA series of conferences to encourage constructive debate about diversity issues in New Zealand, and we collaborated with the Ministry of Foreign Affairs and Trade to support inter-faith dialogue in the Asia-Pacific region.
Enhancing access to community funding and support
Our Community Operations group facilitated over $180 million in funding to communities in 2011/12. Over 9,000 grants for local initiatives, projects and community services were made through 21 Crown funding schemes, Trusts and Fellowships, and on behalf of the New Zealand Lottery Grants Board and distribution committees.
Through our role in regulating gambling we worked to maximise the returns of non-casino gaming profits back to community and charitable purposes. During the year we led amendments to gambling regulations to allow non-casino gaming machine societies to make multi-year grants to their communities.
During the year we enhanced access to funding and support by reviewing schemes to better align with changing community needs and priorities. This included reprioritising funding to enhance the support available for volunteering and for community-led development.
We also streamlined funding processes to make it easier and less time-consuming for people to apply for funding. Changes recommended by the Office of the Auditor-General were implemented to improve accountability processes and the communication channels between community organisations and the Department. We continued to enhance the information available on the CommunityMatters website and other online resources, and we investigated expanding the paperless approach to funding applications, led by our Christchurch office following the Canterbury earthquakes.
Funding processes will be further improved by the development of a new Grants and Client Management System. In 2011/12 a prototype system was trialled and evaluated, from which we clarified business requirements to ensure a new system will meet the needs of the Department and customers now and into the future.
In Budget 2011 $3.3 million was secured to continue supporting digital literacy and connection in communities. This funding supported the Computers in Homes and Computer Clubhouse programmes to provide additional training, tools and resources for school children, young people and families, and improve their ability to participate in their communities in the digital age.
| Indicators | Progress | Data source |
|---|---|---|
| Increasing the participation in local communities through volunteering and giving: | ||
The percentage of people aged 10 years or over who, in the previous three months, volunteered or donated money |
Volunteered: March 2012: 31% December 2011: 32% December 2010: 29% Donated money: March 2012: 39% December 2011: 40% December 2010: 41% |
Quarterly Consumer and Media Insight Survey (Nielsen Media) |
The percentage of people participating in paid and unpaid community work |
Undertook paid community work: 2010: 65.4% 2008: 64.6% Undertook voluntary community work: 2010: 32.4% 2008: 32.6% |
General Social Survey (Statistics New Zealand) |
The number of nominations for Community Organisation Grants Scheme (COGS) Local Distribution Committees |
2011: 304 nominations The next elections will be held at the end of 2013/14 |
Internal Affairs data |
| Maintaining a high level of satisfaction with the advice and support received by ethnic community groups to enable them to help themselves and participate in their community | 30 June 2012: 96% 30 June 2011: 96% |
Internal Affairs survey |
Impact: People are able to access and use information important to their lives
We improved access to important information for people to use to contribute to society and the economy. This work contributed to our outcomes for resilient and prosperous communities; a New Zealand recognised for using knowledge for social, cultural and economic wellbeing; and strong and valued national identity.
We contributed to Ministerial priorities in the following portfolio:
- Internal Affairs
Enhancing secure and convenient access to identity information
The authoritative identity information held by the Department is often crucial for people to efficiently and easily access other services and entitlements, and contribute to a competitive and productive economy.
We provide secure and convenient access to identity information through a suite of services including the igovt logon service, which lets people and business use the same username and password when accessing online services from participating agencies, and the System-to-System Data Access Service, which provides agencies with identity data validation.
These shared identity services allow easier interaction between people and government in a digital environment. During the year we continued to enhance these services, including:
- supporting the progress of legislation to enable wider use of shared services by people, agencies and the private sector[12]
- beginning development of the full igovt identity verification service, to extend eligibility to everyone who lives in New Zealand
- signing a partnering arrangement with New Zealand Post (NZ Post), enabling people to complete the igovt registration process at PostShops and allowing NZ Post to make igovt-related services available to private sector organisations and state-owned enterprises
- developing RealMe, in partnership with NZ Post, to increase uptake of shared identity services[13] by building on existing igovt functionality. RealMe will create an account where people will be able to manage and share their personal information
- working with the Ministry of Social Development’s StudyLink to make student loan applications accessible through igovt from early 2012/13 and exploring the use of identity verification services in the Ministry of Economic Development’s (now Ministry of Business, Innovation and Employment) Companies Office and in the education sector.
The increasing availability of shared identity services means New Zealanders are able to more conveniently and easily access government services. The number of igovt logons created by New Zealanders has continued to increase, along with the number of government services using igovt and the number of access agreements in place to use the Data Access Service. More than five million igovt logon transactions have been conducted since 2007.
Cumulative igovt logon service growth
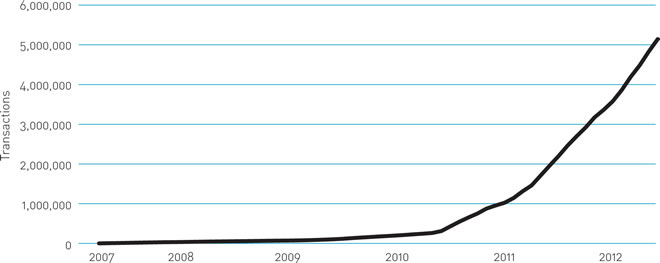
Source: Department of Internal Affairs data
Larger version of image Long description
Improving access to government data
In August 2011 the Government released its Declaration on Open and Transparent Government and new principles for data and information management.
To support greater transparency we developed a strategy for identifying and releasing useful, non-personal information held by the Department, for re-use by the public and businesses.
We played a leadership role in increasing access to government information through data.govt.nz, a directory of publicly available, non-personal government data sets. During the year the listings on data.govt.nz more than tripled to over 1,800 data sets from 148 government agencies, and were accessed by more than 4,000 people each month.
Our Chief Executive chaired the Data and Information Re-use Chief Executives Steering Group, which presented its first report on the adoption of the Declaration on Open and Transparent Government in June 2012. Agencies are moving to incorporate the Declaration into their core business and their data is being re-used by businesses to develop innovative services that reduce cost and processing. Increasingly, business and government are partnering to host and deliver government data.
Information growth on data.govt.nz
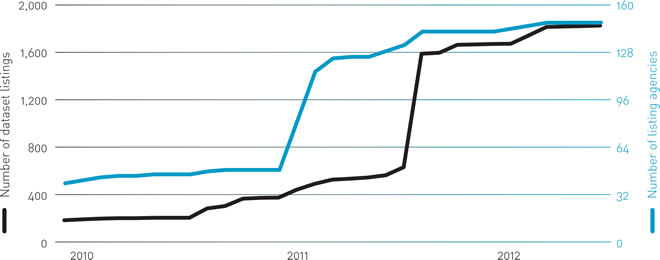
Source: Department of Internal Affairs data
Larger version of image Long description
Improving access to information, heritage collections and the public record
Within the Department, Archives New Zealand and the National Library of New Zealand maintained the record of government and significant collections of New Zealand’s documentary heritage. We provided access to this information through facilities such as reading rooms, interloan services and exhibitions. Increasingly, we are using online services and different channels such as YouTube to reach new and larger audiences for heritage material and government information.
We are increasing the access to heritage information by digitising and making information available online through resources such as DigitalNZ[14]. Over the past three years we have made more than two million items available through the National Library’s online collections and added over one and a half million items to Archway, the online archives index. During 2011/12 this included:
- digitising more than 30,000 New Zealand Defence Force records as part of a project to make all First World War military personnel records accessible before centenary commemorations in 2014
- increasing to over 100,000 the number of images of New Zealand history available on the Alexander Turnbull Library’s Timeframes website
- adding over 450,000 pages to the Papers Past website[15], including the first 50 years of Christchurch’s The Press newspaper. Papers Past is one of the most popular digital resources provided by the Department, with up to 10,000 visits per day in the past year.
We began improving access to our collections and services by redeveloping and enhancing the National Library’s beta website[16]. This is centralising the Library’s online resources to make it easier for researchers and the public to search the Library’s collections.
We continued to support local libraries across New Zealand to connect communities and schools with information, through services such as Aotearoa People’s Network Kaharoa and the Te Puna interloan service. In 2011/12 we launched Kōtui, a shared library management system that enables borrowers and researchers to access the contents of all participating public libraries from a single point (such as a computer or smartphone, from home, school or business, or from within the library). Kōtui had gone live in eight libraries by mid-2012. A further seven libraries will be operational by the end of 2013.
| Indicators | Progress | Data source |
|---|---|---|
| Increasing access to information through uptake of common capabilities: | ||
Number of unique services connected to shared identity services[17] |
June 2012: 38[19] March 2011: 23 service agreements in place |
Internal Affairs data |
igovt logons created by New Zealanders |
2011/12: 460,501 2010/11: 239,330 (number issued) |
Internal Affairs data |
Annual number of transactions supported by the igovt logon service |
2011/12: 3,167,138 2010/11: 1,635,084 |
Internal Affairs data |
Number of access agreements in place allowing use of the Data Validation Service |
June 2012: 730 March 2011: 400+ |
Internal Affairs data |
Number of services using the Data Validation Service[18] |
June 2012: 2 services March 2011: 2 services |
Internal Affairs data |
| Increasing access to collections of information and the public record: | ||
Published National Library heritage collections with online records* |
2011: 86% (509,792 of 591,069) 2010: 83% (481,340 of 575,778) |
Internal Affairs data |
Institutions describing archival holdings online through the Community Archive |
2011/12: 376 2010/11: 376 |
Internal Affairs data |
Proportion of contextual documentation about public archives that meets quality standards |
2011/12: 50.6% 2010/11: 50.6% |
Internal Affairs data |
Full-text databases made accessible through New Zealand libraries in the Electronic Purchasing in Collaboration (EPIC) consortium* |
2011: 40 2010: 25 |
Internal Affairs data |
New Zealand libraries participating in the Te Puna catalogue and interloan services |
2011/12: 92%[20] 2010/11: 98% |
Internal Affairs data |
New Zealand libraries and marae with Aotearoa People’s Network Kaharoa (APNK) connected |
2011/12: 145 public libraries and marae 2010/11: 130 public libraries and marae |
Internal Affairs data |
Visits to use specialist online resources and services for schools* |
2011: 172,905 July-December 2010: 40,000 visits |
Internal Affairs data |
Earthquake-affected school libraries in Canterbury assisted to rebuild their capacity and capability |
Advisory support provided to 96% of targeted schools | Internal Affairs data |
- *
- Data collected for calendar year. 2012 data not yet available
Impact: New Zealand’s documentary record is protected and available for current and future generations
We collected, protected and preserved New Zealand’s historical memory and taonga. This work contributed to our outcomes for resilient and prosperous communities; a New Zealand recognised for using knowledge for social, cultural and economic wellbeing; and strong and valued national identity.
We contributed to Ministerial priorities in the following portfolio:
- Internal Affairs
Redevelopment of the former National Library building
During the year we made substantial progress towards completing the redevelopment of the former National Library building in Wellington. Renovations have been underway since 2009 to ensure the long-term storage and preservation of collections of national importance. Staff began moving back into the building in April 2012, with the reading rooms opening to the public from August.
The purpose of the building has been extended to include housing Archives New Zealand’s key government documents. This will maximise the benefit of improved storage facilities to ensure a greater proportion of New Zealand’s documentary record is being stored in an appropriate, controlled environment.
Consultation began during the year on a name change for the building, to better reflect its new role as a home for Archives New Zealand and the National Library.
The refurbished building has improved access to heritage collections and enhanced facilities for visitors and researchers. The building’s new Constitution Suite will bring together New Zealand’s important foundational documents such as the Treaty of Waitangi, the Women’s Suffrage Petition and the Declaration of Independence of the Northern Chiefs, preserving them in appropriate, controlled environments and optimising the experience for visitors. We began preparing for the move of these documents by consulting with stakeholders and mana whenua.
The building provides the platform for improving our frontline services to researchers, visitors and the public, while creating efficiencies by sharing resources.
To support this, a strategic partnership between Archives New Zealand and the National Library has been agreed. The partnership extends the modernisation of National Library services to include areas of commonality between the two institutions, while maintaining separate statutory responsibilities. We began redesigning services from a citizen-centric view, to more efficiently and effectively use specialist preservation skills, facilities and programmes to protect New Zealand’s documentary heritage and records.
Protecting and preserving items for future generations
We continued to build the collections we hold on behalf of New Zealanders. During the year we increased the quantity of archives held by 5.5% to over 103,000 linear metres and added nearly 70,000 items to the Alexander Turnbull Library’s collections.
By leading the digitisation of historic records we are improving the long-term preservation of information for future generations.
During the year we improved the systems for collecting and preserving information by developing a Joint Digital Preservation Strategy to better share expertise between the National Library and Archives New Zealand. We also continued to develop the Government Digital Archive (GDA) to ensure New Zealand’s record of government is effectively captured and preserved in the digital age, including successfully transferring the first items from an Interim Digital Archive to the GDA repository.[21] By 2018 the Digital Archive aims to be the primary preservation repository for New Zealand’s government, heritage, research, learning and community digital content.
We increased the items we hold in digital form, staying on track to meet targets of digitising 90% of our archive heritage items by 2018. In 2011/12 we digitised highly-used Canterbury and Westland archives and continued a project to digitise probate records, with over 90,000 records now available to assist family researchers. Through a collaborative programme between Land Information New Zealand and Archives New Zealand, we digitised and made available online 145,000 images of Deeds Indexes.[22]
The National Library continued leading a collaborative project to digitise the Appendices to the Journals of the House of Representatives, adding 125,000 pages to AtoJs Online. We also exceeded targets for preserving at-risk Alexander Turnbull Library heritage items, including over 2,000 hours of rare music recordings, spoken word and oral histories, as part of the Audio Retro Preservation Programme.
We maintained and developed partnerships with Māori and Pacific communities to ensure cultural heritage and taonga are preserved correctly and are accessible for future generations. During the year we worked with five iwi[23] to develop Letters of Commitment on the long-term care and management of their taonga, as part of the Crown’s settlement of Treaty of Waitangi claims. We also began discussions with Taranaki Whānui to plan a work programme to implement the Letter of Commitment on their taonga, signed in the previous year.
| Indicators | Progress | Data source |
|---|---|---|
| Completing redevelopment of the National Library Wellington building by the end of 2012 | On track | |
| Increasing the proportion of heritage collections and public records protected and preserved for future generations: | ||
The proportion of Alexander Turnbull Library collections held in an appropriate environment |
2012: 100% 2010: 55% |
Internal Affairs data |
The proportion of Archives New Zealand holdings held in an appropriate environment |
2011/12: Relative humidity standards met 67.1% of the time; Temperature standards met 80.6% of the time 2010/11: Not available |
Internal Affairs data |
The number of public offices that are holding archival value records over 25 years of age without a formal agreement with the Chief Archivist |
2011: 27%* 2010: Not available |
Internal Affairs data |
- *
- This relates to a specific project to identify records and is no longer measured.
Impact: New Zealand’s personal identity information has integrity
We worked to ensure New Zealand’s personal identity information was secure, trusted and appropriately accessible. This work contributed to our outcomes for strong and valued national identity; and a New Zealand recognised for using knowledge for social, cultural and economic wellbeing.
We contributed to Ministerial priorities in the following portfolio:
- Internal Affairs
Providing secure and reliable identity information
We collect and securely manage the official record of life events in New Zealand. In 2011/12 we issued over one million identity documents and products enabling New Zealanders to use their identity information to access rights, entitlements and services.
Ensuring confidence in New Zealand’s personal identity records is central to maintaining the high degree of trust people, organisations and other nations have in
New Zealand’s identity information. During the year we began a biometric matching exercise across the passports database to ensure New Zealand has the highest possible security and integrity for its passports and issuance systems.
Within an environment of increasing demand, we continued to deliver documents and products with a high degree of reliability. We maintained over 99% accuracy of citizenship certificates provided to the public. We maintained the international reputation of the New Zealand passport as a trusted identity document with less than 0.02% of passports issued on fraudulent grounds or used fraudulently. Surveys of identity customers over the past three years show, on average, over 95% of people are satisfied with our services.[24]
Demographic changes, technological advances and legislative changes such as the move to five-year passports impact on how people are using identity services. We continued to implement the Passport Redevelopment Programme to meet rising demand for passports, including preparing to introduce adult online passport renewals in October 2012. During the year we mitigated the impact of vendor delays to the programme to ensure we maintained full and uninterrupted services to customers.
We are responding to changing demand by reviewing our identity documents, products and services to ensure they are sustainable and flexible to meet future needs, particularly in a digital environment. Upgrades to the Birth, Deaths and Marriages and Citizenship Operating systems will reflect the results of the review.
Identity documents issued
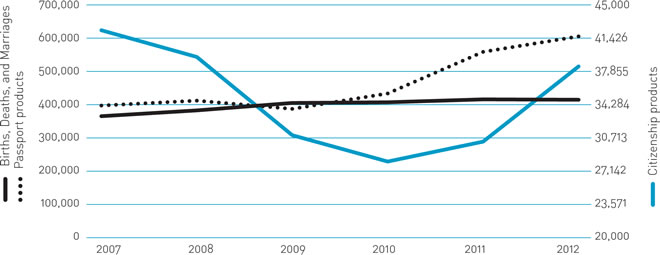
Source: Department of Internal Affairs data
Larger version of image Long description
Providing leadership in identity information management
We continued to provide leadership on the secure management of identity information to ensure the consistency and quality of identity management across government.
This includes working with agencies to develop and communicate best practice in the establishment of identity and the collection of identity information. In 2011/12 we developed, with the Ministry of Justice, an Identity
Verification Code of Practice to support reporting entities to fulfil their obligations under anti-money laundering legislation.
Maintaining integrity in the access to and management of personal information is critical as more government services become accessible online. We continued to expand the use of shared identity services that enable people and agencies to use identity information and verify identity confidently in a digital environment. More information about this work is provided under the previous impact section ‘Enabling people to access and use information important to their lives’.
In April we hosted the international identity conference, Managing Digital Identity in a Networked World, in partnership with Victoria University of Wellington and the Office of the Privacy Commissioner. The conference brought together more than 200 people from the public and private sectors, as well as international and national thought leaders, to discuss identity management issues including how government agencies can build and develop trusted relationships with their customers in an online environment.
The conference contributed to the Department’s focus on engaging with stakeholders across sectors to develop a vision of the future state of identity information management, to help inform government decisions about investment in this area.
| Indicators | Progress | Data source |
|---|---|---|
| Maintaining a low level of complaints about the Department on privacy breaches | Complaints received or notified by the Privacy Commission: 2011/12: 2 2010/11: 4* 2009/10: 2 |
Office of the Privacy Commissioner Annual Report |
| Maintaining a low level of incident reports relating to the issuance of passports on fraudulent grounds or fraudulent use of a passport | Related incidence reports: 2011: 0.013% 2010: 0.012% |
Internal Affairs data |
| Maintaining a high percentage of identity services customers who feel personal information is confidential and secure | Nov 2011: No survey run Jun 2011: 90% (751) Nov 2010: 90% [750] Jun 2010: 81% (750) Nov 2009: 86% [749] Jun 2009: 86% (751) Nov 2008: 85% [749] |
Internal Affairs survey** |
- *
- Number of complaints upheld.
- **
- Note that the percentages in the 2012–15 Department of Internal Affairs Statement of Intent are incorrect as responses of ‘no impression’ were included in the figures (June 2011 97%, Nov 2010 98%, June 2010 92%, Nov 2009 98%, June 2009 99%, Nov 2008 99%).
Contributing to objectives
The following section reports on our contribution to achieving objectives and progress on the priorities, initiatives and indicators outlined in our Statement of Intent.
We contributed to our objectives through the following lead objectives:
Objectives indicators
We used the indicators below to track progress towards our objectives.
| Objective | Indicators | Trend | Data source |
|---|---|---|---|
| To enhance trust in government and confidence in the performance of public sector organisations | Increasing the number of people who have a high level of trust and confidence in the performance of public sector organisations: | ||
Overall quality score for public services |
2012: 72% 2009: 69% 2007: 68% |
Kiwis Count Survey – New Zealanders’ satisfaction with public services (State Services Commission)[25] | |
New Zealanders’ positive rating of overall trust in public services |
2012: 42% 2009: 33% 2007: 29% |
||
New Zealanders’ positive rating of trust in their most recent service interaction |
2012: 74% 2009: 70% 2007: 67% |
||
New Zealanders who agree that public services are a good example of tax dollars spent |
2012: 73% 2009: 64% 2007: 55% |
||
| Maintaining New Zealand’s ranking in the Corruption Perceptions Index | 2011: 1st 2010: 1st = 2009: 1st |
Transparency International | |
Although our work makes an important contribution to achieving objectives, indicators are influenced by environmental factors beyond the impact of the Department’s activities and services. Due to the high-level and long-term nature of objective indicators, many of our data sources are not conducted on an annual basis. We have reported on the most up-to-date data available.
Lead objective: Supporting the system of government to operate efficiently and effectively
We supported central and local government to deliver better services to New Zealanders and interact more easily with people in a digital environment. This work contributed to our objectives for enhancing trust and confidence in the performance of New Zealand’s public sector.
We contributed to Ministerial priorities in the following portfolios:
- Internal Affairs
- Civil Defence
- Ministerial Services
- Ethnic Affairs
- Local Government
- Racing
- Community and Voluntary Sector
Improving interaction between New Zealanders and government in a digital environment
In March 2012 the Department became the lead agency for one of the Government’s priorities for better public services: enabling New Zealanders to complete their transactions with government easily in a digital environment (Result 10). The Minister of Internal Affairs is the lead Minister for Result 10.
This work will be a priority for the Department over the next five years. To support this, the Service Transformation Programme transferred to the Department from the Ministry of Social Development (MSD), aligning with our Chief Executive’s responsibilities for Result 10 and as the Government Chief Information Officer. Initially a collaborative project between the Department, Inland Revenue and MSD to develop joint service delivery approaches, the Programme has expanded to include over 20 agencies to progress the result area work.
The Programme Team worked with these agencies to develop a Result 10 Action Plan, including a target of 70% of New Zealanders’ most common transactions with government being completed in a digital environment by 2017. Currently 24% of these transactions are completed digitally.[26] Action areas will develop consistent approaches to common transactions and foster initiatives and partnerships that deliver citizen-centric digital services.
Understanding how people want to interact with government is crucial to developing services that meet people’s needs. We completed an inventory across government agencies to gain a consistent picture of the current state of service delivery across the public sector. This informed the development of citizen profiles on which to base future service design work.
As part of the result area work we began developing connections with Result 9 (led by the Ministry of Economic Development), which focuses on ensuring business can interact with government online.
Leading all-of-government information and communications technology
The result area work is closely aligned with the Department’s responsibility for leading more effective use of ICT across the public sector, by implementing the Directions and Priorities for Government ICT and advising Government on maximising the use of all-of-government ICT.
In August 2011 we launched the Government ICT Roadmap as the underpinning strategy for the Directions and Priorities. We supported this with tools, resources and guidance, for agencies to better align their ICT planning and identify opportunities for sharing capability. A new website was launched to centralise this information, www.ict.govt.nz.
In June Government strengthened our Chief Executive’s mandate, as the Government Chief Information Officer, to accelerate the uptake of shared capabilities and common ICT tools that will support more citizen-centric services.
We continued to lead sound investment and engagement with industry to introduce innovations and initiate different ways of planning and operating government’s ICT systems. In 2011/12 we established the foundations for significant cost and efficiency savings across government through better use of ICT, including:
- increasing the benefits of Government Infrastructure as a Service[27] (IaaS) by signing new suppliers and exceeding forecast uptake from government[28]. IaaS will potentially save government more than $250 million over 10 years
- enhancing the one.govt common network, negotiating a more flexible all-of-government software acquisition strategy and collaborating with the Ministry of Economic Development to sign common computer, print and mobile data contracts, improving efficiency and achieving potential savings of $200 million over five years
- developing a business case for the use of cloud computing to improve standardisation and value for money across government
- providing common web services that provide government agencies with a small, consistent choice of web publishing platforms and services
- piloting the Open Door to Innovation Initiative, which seeks innovative ideas from the ICT industry to improve government ICT investment. We received over 500 queries resulting in 29 submissions.
More coordinated ICT across government is central to providing more convenient and cost-effective public services and allowing easier interaction between citizens and government. New Zealanders are increasingly accessing government information and services online, and a recent United Nations e-government survey shows New Zealand is continuing to improve its ability to connect people and government in a digital environment.
Ability of citizens and government to interact online
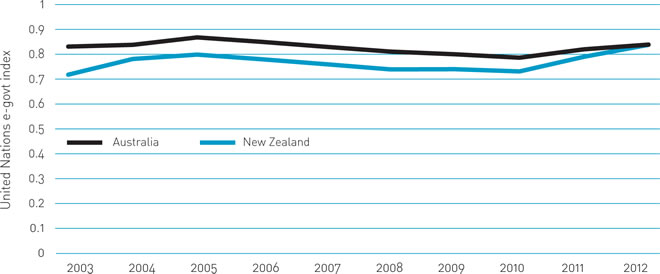
Source: United Nations E-Government Survey 2012[29]
Larger version of image Long description
Supporting efficient and effective local government
An ongoing focus for the Department is providing advice and operational support to improve the effectiveness of the local government system and strengthen its contribution to the economy.
The Better Local Government Programme, announced by Government in March 2012, includes a number of reforms to improve the ability of local authorities to serve their communities efficiently and effectively.
We supported the progress of the Local Government Act 2002 Amendment Bill to implement the first phase of the Programme. This will refocus the purpose of local government, introduce financial prudence requirements, strengthen governance provisions and streamline council reorganisation procedures. We also supported the establishment of an independent Local Government Efficiency Taskforce to help build greater efficiency within the system of local government.
The Programme builds on reforms passed in 2010, to improve local authority transparency, accountability and financial management. During the year we began implementing these amendments by preparing regulations for financial reporting requirements, and completing the first phase of developing performance measures for core local government activities.
The Department also led the development of the Local Electoral Amendment Bill, proposing improvements to strengthen the integrity and efficiency of the local electoral system and the conduct of local elections.
We continued to support the Auckland Council following its establishment, including working with the Ministry for the Environment to coordinate government engagement with the Auckland Spatial Plan, and supporting the inaugural Auckland Central Local Government Forum.
During the year, the Minister of Local Government was asked to intervene in and assist a number of councils. We provided advice and support to the Minister in addressing governance, performance and financial challenges in councils, including appointing and supporting Crown observers and review teams where necessary.
Improving the systems and services supporting Executive Government
We maintained a high level of trust and confidence in our ability to provide services supporting the efficient operation of Executive Government. Improvements made to optimise these services during the year included integrating ICT service delivery between the Department and the Parliamentary Service and improving services to Members of the Executive. This initiative achieved efficiency savings of over $400,000 during the change of Executive following the 2011 General Election.
During the year we implemented new policies and guidance for managing Ministerial expenses. We also supported the progress of the Members of Parliament (Remuneration and Services) Bill and began working with the Remuneration Authority and the Parliamentary Service to prepare for changes to our role in administering allowances for Members of Parliament following the Bill’s enactment.
We supported more than 70 official visits and a number of significant commemoration events in 2011/12, including the funeral of Sir Paul Reeves and the first anniversary of the Canterbury earthquakes. Our contribution to Rugby World Cup 2011 included supporting the guest-of-government and state functions programme, working with the Ministry of Foreign Affairs and Trade, Ministry of Economic Development and other agencies to ensure a successful whole-of-government approach to the 28 state functions and visits during the tournament.
Preparations also began for upcoming events, such as the Royal Jubilee Visit in November 2012 and First World War Centenary Commemorations.
We continued to provide support to two Royal Commissions of Inquiry, into the Pike River Coal Mine Tragedy and Building Failure Caused by the Canterbury Earthquakes. This included securing approval for extensions to the reporting dates for both inquiries.
Supporting effective Government decision-making
The Department undertakes research, data-gathering and stakeholder engagement to support government decision-making with high-quality policy analysis and advice. This includes working with other agencies to support sound policy development. For example we advised the Ministry of Economic Development on the policy and regulatory framework for gambling.
During the year we responded to Government expectations for the public sector to improve policy advice by implementing a Quality Plan to continue developing the performance and productivity of our policy functions.
We provided advice and assurance to Ministers on the performance, capability and governance of the Charities Commission[30], the New Zealand Fire Service Commission and the Office of Film and Literature Classification.
We also provided Ministers with advice regarding funding bodies, community trusts and specialist groups including the New Zealand Racing Board, Charities Registration
Board, Film and Literature Board of Review, Film and Video Labelling Body, Gambling Commission, Local Government Commission, Guardians Kaitiaki of the Alexander Turnbull Library, and the Library and Information Advisory Commission.
| Indicators | Progress | Data source |
|---|---|---|
| New Zealanders can complete their transactions with government easily in a digital environment: | ||
70% of New Zealanders’ most common transactions with government will be completed in a digital environment by 2017 |
2011/12: 24% of common transactions are completed digitally | Internal Affairs data |
| Increasing uptake of common capabilities | See impact measures for Enabling people to access and use information important to their lives | |
| Improving the accessibility of online government services: | ||
People who have used the Internet to get information on government or council services |
2011: 57% 2009: 60% 2007: 45% |
World Internet Project New Zealand Survey 2011 |
People who have used the Internet to use government or council services that are delivered online |
2011: 48% 2009: N/A |
|
| Increasing satisfaction with government online services: | ||
People’s satisfaction with the Internet as the most recent contact channel with government |
2009: 81% 2007: 73% |
Kiwis Count Survey – New Zealanders’ satisfaction with public services (State Services Commission[31]) |
People’s satisfaction with carrying out transactions with government online |
2009: 64% 2007: N/A |
|
| Optimising support for Executive Government: | ||
Satisfaction rating for the Department’s services from the Minister Responsible for Ministerial Services |
2011/12: Good/very good 2010/11: Very good 2009/10: Very good 2008/9: Very good 2007/8: Good |
Internal Affairs data |
| More efficient and effective local government: | ||
People who understand how their Council makes decisions |
2010: 40% 2008: 38% 2006: 39% |
Quality of Life Survey |
People who feel they have an influence on Council decisions |
2010: 62% 2008: 60% 2006: 58% |
|
| Enhancing the value of information available to support government decision-making | We are participating in a Treasury-led pilot of common performance measures for policy advice across government. In May 2012 our overall average score for Ministerial satisfaction with policy advice was 7.3 out of 10 from the four portfolio Ministers participating in the pilot.[32] |
|
Lead objective: Enhancing the productivity and accountability of public sector organisations
We supported central and local government agencies to increase their capability to serve their communities. This work contributed to our objectives for enhancing trust and confidence in the performance of New Zealand’s public sector.
We contributed to Ministerial priorities in the following portfolios:
- Internal Affairs
- Civil Defence
- Community and Voluntary Sector
- Ethnic Affairs
- Local Government
Building capability in the civil defence emergency management sector
We completed and reported on capability assessments of New Zealand’s 16 regional Civil Defence Emergency Management (CDEM) Groups.
The results show that, overall, New Zealanders can be confident in the capability of CDEM Groups. The average capability score was 60%.[33] All Groups are operating in the ‘satisfactory’ zone, with four CDEM Groups considered high-performing (scoring over 70%). Areas for improvement have been identified both in individual groups and across all regions. We are supporting CDEM Groups to implement improvement plans addressing the findings of the capability assessments.
During 2011/12 we completed the roll-out of the Emergency Management Information System (EMIS). All CDEM Groups have signed on to use the system, which provides a shared information and communications system during civil defence events. Since implementation, EMIS has been used for two local emergency response events and, although the events were relatively small, the system performed well.
We also began developing terms of reference for a review of fire services. This will support equitable and efficient funding arrangements and address an increasing trend in firefighters attending non-fire-related emergencies.
Increasing the capability of public sector agencies to work with and respond to communities
As well as working directly with communities, the Department provides advice and tools to help agencies better understand the needs of their communities so they can deliver services more effectively. We led by example in building strong relationships with stakeholders, groups and other agencies to address community and voluntary sector issues, and we are overseeing the implementation of the Kia Tutahi Relationship Accord.
In August 2011 we launched the Ready Reference Engagement Guide, providing advice to public servants on engaging effectively with citizens and communities when developing policies and services. The guidance is designed to optimise agencies’ responsiveness to communities to create sustainable and appropriate policies and programmes.
Within the Department, the Office of Ethnic Affairs continued to work with agencies to improve responsiveness to ethnic diversity. To meet increasing demand for these services we implemented new tools, including web-based policy guidance and a revamped Nominations Service to inform the appointment of ethnic candidates to government boards, committees and advisory groups.
We also continued to support agencies by providing Language Line and expanding interpreting services to 43 languages.[34] In the nine years since it began, Language Line has helped more than a quarter of a million people in New Zealand access essential services. In 2011/12 we increased the number of participating agencies to 83 and responded to approximately 39,000 requests for interpreting services.
Language Line growth
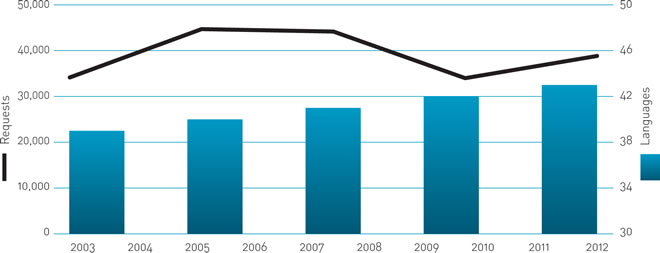
Source: Department of Internal Affairs data
Larger version of image Long description
Increasing the capability of agencies to manage public records
Through Archives New Zealand we preserve evidence of how government carried out its responsibilities. We worked collaboratively with other agencies to increase their capability to protect information and fulfil their obligations to maintain public records. During the year we audited the recordkeeping of 43 public sector agencies as part of our ongoing responsibility to audit all agencies over a five-year cycle.
The Christchurch earthquakes, which resulted in the loss of public records, highlighted the fragility of documentary heritage and the need to put steps in place for recovery and back-up.
We provided information and advice to agencies across the public sector on protecting and preserving information, providing more than 40 government recordkeeping training courses during the past two years. We reviewed our services to enhance relationships with our clients in government, local government and the community and improve capability to carry out recordkeeping.
| Indicators | Progress | Data sources |
|---|---|---|
| Average score for the capability of Civil Defence Emergency Management Groups to achieve the goals of the National CDEM Strategy | 2011/12: 60% | CDEM Capability Assessment Tool |
| Capability development assessment for non-Civil Defence organisations | Indicators being developed[35] | |
| Improving responsiveness of public agencies to the needs of diverse communities: | ||
Increasing the number of public sector organisations using Language Line |
2011/12: 83 2010/11: 77 2009/10: 73 |
Internal Affairs data |
| Improving capability of public sector agencies to maintain the integrity of public records they hold: | ||
Organisations that have policies and procedures to assess whether they are complying with the Public Records Act 2005 |
2011: Not measured* 2010: 46% (47% under development) 2009: 37% (52% under development) 2008: 29% (59% under development) |
Government Recordkeeping Survey Report[36] |
Percentage of core public offices with a formal recordkeeping programme |
2011: Not measured 2010: 59% |
|
Percentage of core public offices with a disposal authority that covers their core business records |
2011: Not measured 2010: 46% |
|
Percentage of core public offices that have undertaken a risk assessment against a mandatory standard |
2011: Not measured 2010: 38% |
|
- *
- This was not measured for 2011, because the work has been superseded by other initiatives, such as a review of appraisal.
Lead objective: Supporting specialist capability-building in other nations
We contributed to enhancing trust in New Zealand government by using our expertise and resources to build capability in other nations.
Supporting public recordkeeping and information management
We shared our specialist skills and expertise to build capability in other nations, particularly in the Pacific region. We increased the capability of other nations to maintain the integrity and improve management of the public and personal information they hold. During 2011/12 we:
- signed a new five-year Arrangement on Cooperation between the National Library of New Zealand and the Singapore National Library Board to build capability in digital preservation and promote literacy through library service in the Asia-Pacific region
- continued our ongoing support as the secretariat of Pacific Regional Branch of the International Council on Archives (PARBICA). We worked with colleagues from Australia and the Pacific to develop and launch Phase 5 of the Pacific Recordkeeping for Good Governance Toolkit at the PARBICA conference, providing information on best practices for digital recordkeeping
- began working with the German Federal Archive to digitise and improve the accessibility of documents held by Archives New Zealand relating to the German administration of Samoa
- advised the Samoan Bureau of Statistics on improving the country’s birth, deaths and marriages operations, and improving the quality and integrity of this data.
We also worked with international agency groups such as the Five Nations Passport Group, Five Nations Citizenship Group and International Civil Aviation Organization to share best practice in identity management and keep abreast of developments in international border security and technology.
Supporting emergency response capability
The Ministry of Civil Defence and Emergency Management contributed to building international emergency response and risk management capability by supporting programmes such as the Ministry of Foreign Affairs Pacific Programme and the Pacific Tsunami Risk Management Programme. We contributed resources and expertise to support international civil defence exercises, including Exercise Pacific Wave and a review of the United Nations Disaster Assessment and Disaster Coordination system.
Building regulation and compliance capability
The Department chaired the Australasian Gambling Regulatory Information Forum, which includes representation from gambling regulators across Australia and Singapore. The Forum improves information-sharing with regulators in these countries, and enhances the understanding of trends and developments to improve compliance and regulation practices.
Building Organisational Health and Capability
Building our capability is an ongoing priority. Our focus during the year was on consolidating our structure and the systems supporting the effective operation of the Department.
Consolidating the Department’s structure
Since the establishment of the integrated Department on 1 February 2011[37], we have been implementing the next level of organisational changes needed to ensure the organisation is sustainable in delivering core services and meeting new expectations.
This year, we completed reviews of several business groups and units to reduce duplication and deliver functions more efficiently and effectively. This process has resulted in new business models that reflect the changing nature and scope of our work. This included:
- implementing a new structure for our Policy group to improve the flexibility, quality and strategic focus of policy advice
- reviewing information and technology services, including the Office of the Government Chief Information Officer, to increase our capability to support all-of-government ICT, and improve our approach to agency engagement and governance support
- implementing improved business models across Ministerial support services to build capability, reduce costs, and prepare for future challenges
- building the strategic and operational capacity of the National Library, including better integrating digital technology across all its activities
- restructuring Archives New Zealand to better reflect its relationship to customers, the flow of information across the recordkeeping and archival system, and the development of digital archiving
- focusing our community operations to better deliver frontline services, with a streamlined, more flexible and efficient management structure
- investing in an Enterprise Portfolio Management Office to provide better oversight of the Department’s portfolio and improve decisions about allocating resources
- establishing a new business model for our shared corporate services, strengthening the focus on delivering trusted business advice, leadership and assurance to the Department. This included reviews of our finance, human resources, communications, and property and procurement operations, to ensure the Department has the necessary support to deliver its services.
Following Government’s announcement of our responsibility for Better Public Service Result 10, the Service Transformation Programme transferred to the Department. The Programme Team, including staff from several agencies, enhances our capability to provide cross-agency leadership in developing citizen-focused services and is responsible for implementing the Result 10 Action Plan.
Parallel to the organisational reviews we developed a Position Management System that is now being implemented. This system provides better oversight and allocation of our staffing resources within our overall organisational structure. It will enable the Department to manage resources more cost-effectively within an environment of fiscal constraint.
Preparing for the transfer of the functions of the Charities Commission
We prepared for the transition of the registration, education, monitoring and investigation functions of the Charities Commission to the Department on 1 July 2012. The transfer will ensure these functions are housed in a larger, more resilient agency, better equipped to remain financially viable in challenging financial circumstances.
The addition of these functions showed that we could continue to incorporate new functions without significant disruption to our structure. The transfer is expected to achieve efficiencies through sharing back-office functions and reducing duplication, while improving services to the charitable sector.
Building our people capability
During the year we implemented and began a number of organisational improvements to enhance our people capability and organisational culture. This included:
- substantially completing our first Department-wide Workforce Strategy. This provides the Department with an overarching framework and direction to ensure we have the people and capability to continue delivering core functions, while being able to adapt to business changes and contribute to the achievement of Government priorities
- developing a new Leadership and Management Development Framework designed to support managers and develop good leaders at all levels of the organisation. We are piloting programmes including succession planning and talent development, new manager inductions, refresher courses for existing managers and individualised training plans. The framework will be rolled out over the next two years
- implementing iLearn, an online training service that will centralise all information relating to learning and development, and make it easier for our staff to access and manage training.
A significant achievement during 2011/12 has been the development and implementation of a new performance management system. We also negotiated a new, single collective agreement which included a common remuneration system. These new arrangements reduce duplication by replacing multiple legacy systems inherited following the integration of the National Library and Archives New Zealand into the Department.
A Department-wide Engagement Survey was undertaken in March 2012 to benchmark staff engagement. This was the first such survey undertaken since the February 2011 integration. The survey had an excellent response rate of 84%.
The survey showed that, while team culture and support are a strength within the Department, organisational engagement is low. Overall results showed 9.3% of employees are considered engaged, 56.6% ambivalent and 34.1% disengaged, compared with respective State Services benchmarks of 23%, 59.6% and 17.4%. Our employee engagement index was 59.5%, compared with the State Services benchmark of 70.2%.[38]
The results have highlighted the areas requiring improvement to build our organisational culture. Lifting engagement is a key focus for the Department’s Executive Leadership Team and work has begun to implement actions to address the findings of the survey. We view this as a high priority given the strong relationship between employee engagement and productivity.
Improving our systems and infrastructure
We developed a Corporate Infrastructure Strategy and began a programme of work to ensure the Department’s core corporate functions and the infrastructure supporting these are robust and sustainable. The first stage of the strategy includes enhancing Finance and HR Management Information Systems and an Enterprise Content Management and Search Information System. It is expected this will be a four-year programme of work.
We continued to investigate sharing a range of back-office functions and service delivery with other agencies. During the year we implemented an integrated IT service delivery initiative with parliamentary agencies. This will result in considerable savings ($1.52 million) over a five-year period through avoiding the cost of operating and maintaining separate systems.
We also started work on a Property Strategy to better understand and reshape the Department’s longer-term property needs, and we made progress on the development of a framework for managing the Department’s physical, ICT and people security.
During 2011/12 we improved our cost-effectiveness by accessing all-of-government procurement agreements implemented by the Ministry of Business, Innovation and Employment for desktop/laptop computers, air travel, travel services, print, motor vehicles, electricity and stationery.
Improving our technology capability
As the chief advisor to government on investment in ICT, we continued to build our internal capability to demonstrate best practice and leadership in the cost-effective use of ICT to achieve outcomes.
We developed an organisation-wide ICT Strategy aligning our internal planning with the Directions and Priorities for Government ICT, for which we are responsible for providing leadership across government. We also developed a roadmap to guide our ICT initiatives and investments in accordance with the strategy.
Work continued to consolidate the systems and processes inherited from the integrated agencies. This included developing an Information Management Strategy, to more effectively manage and access our knowledge, information and data resources, and enhance compliance with government standards. We audited ICT assets and reviewed management and purchasing processes, contributing to efficiency savings across the Department.
We implemented initiatives to improve ICT procurement for both the Department and the wider public sector. These included a Market Engagement Framework for more proactively engaging with the market and vendors, and developing an overview of the procurement pipeline to identify and engage with businesses at the early stage of projects. We continued to identify opportunities for savings through better contract management, rationalisation and leveraging all-of-government opportunities.
Maintaining sound financial management
A priority for the year was to prepare the Department for operating effectively within an environment of reduced baseline funding. We implemented a programme of initiatives to identify efficiencies and reduce duplication throughout all parts of the business, aligned with the process of consolidating our structure. As a result we have positioned ourselves to achieve an efficiency savings target of $9.8 million for 2012/13 and $8.9 million in outyears, announced in Budget 2011.
We have also funded 2012/13 cost pressures and reprioritised funds to support high-priority activities such as Royal Commissions of Inquiry and the administration of the Christchurch Earthquake Appeal Trust. In total these efficiency savings, cost pressures and reprioritised funds represent approximately 10% of the Department’s Crown-funded baseline.
In response to Government expectations, the Department has initiated a programme of work with the overall objective of developing and implementing an enhanced asset management framework that is appropriate and optimal, and which will:
- improve asset management maturity and capability
- ensure that the value of the asset base to the Department is maximised
- ensure business outcomes are optimised
- align investments with strategic direction
- ensure appropriate management practices are applied at each stage of the asset lifecycle process.
Our financial performance
In the 2011/12 financial year a combination of strong third party revenue and underspend in personnel and other operating costs gave the Department an operating surplus of $22.7 million. This consists of a combined net surplus on third party funded operations of $12.1 million, in-principle expense transfers of $8.1 million and retention of underspend of $2.5 million.
Third party funded operations for services provided by the Department are required to break even over a number of years, so will periodically move between surplus and deficit.
In-principle expense transfers are used to carry forward funding for specific projects from one year to the next where there are uncontrollable delays and the costs cannot be met from the baseline of the following year.
In June 2012 the Department obtained Cabinet approval to retain the full amount of any unspent Crown-funded departmental output expense appropriations, and that these amounts would be transferred to 2012/13 to provide initial funding to support Result 10, service transformation and cross-government ICT initiatives programmes of work.
Our workforce profile[39]
Our Workforce Strategy will help us ensure our workforce profile more closely reflects New Zealand communities, enabling us to work more effectively with our customers and attract the people and capability we need in the future.
At 30 June 2012 we had 2,255.6 full-time equivalent staff (FTEs). We continue to carefully manage vacancies to address variances with our staffing cap, which currently sits at 2,223.4 FTEs. It is expected that the number of established positions will increase by approximately 37 FTEs in July 2012 following the transfer of the functions of the Charities Commission to the Department.
- The average age of our employees is 43 years, with 31.8% under 35 years and 23.8% over 55 years. We are experiencing the ageing workforce trend exhibited across the rest of the public sector.
- We have a gender split of 59% female and 41% male. This is similar to the overall public sector profile.
- We have over 70 different ethnicities represented in our workforce. Of our employees:
- 8.7% identify as Māori, compared with a public sector average of 16.4%
- 5.6% identify as Pacifica, compared with a public sector average of 7.6%
- 7.3% identify as Asian, in line with the public sector average of 7.4%.
- The Department’s overall voluntary turnover is 14.6%, compared with the public service average of 10.9%. Turnover has trended upward over the past three years, in line with the rest of the public sector. However, we have reduced turnover significantly from a peak in 2008 of over 20%.
- Average annual sick leave is 6.3 days, compared with the public service average of 7.4.
FTEs – five-year trend
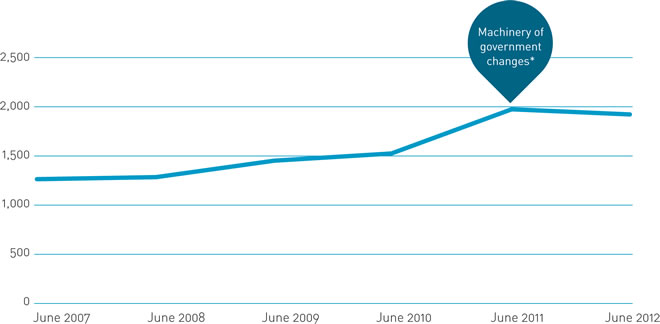
- *
- National Library, Archives New Zealand, the Office of the Government Chief Information Officer, and the Office for the Community and Voluntary Sector join Internal Affairs.
Larger version of image Long description
Footnotes
[1] Outcomes relate to areas in which we provide immediate services to the wider public and consequently affect their quality of life. Objectives describe how we seek to support public sector and other organisations to deliver better, smarter services to, and with, the people of New Zealand.
[2] Latest results (2010) do not include responses from Auckland residents due to the recent establishment of the Auckland Council.
[3] As above.
[4] The assessment of the response claims will be completed in early 2012/13. In March 2012 the responsibility for processing recovery claims was transferred to CERA.
[5] The update of the National CDEM Plan was underway and on track for completion during 2011/12 before being put on hold as a result of the response to the February 2011 earthquake.
[6] Ministry of Civil Defence and Emergency Management Campaign Monitoring Research 2012. 49% of New Zealand residents are aware of the Get Thru website (up from 40% in 2011). The website provides advice on how to prepare to get through emergencies. Awareness of the Get Ready Get Thru tagline has increased to 59% (from 41% in 2009).
[7] Prepared at home means having an emergency survival plan, survival items and water. Being fully prepared means also being prepared when away from home.
[8] A mobi site is a website easily accessible from mobile devices and smartphones.
[9] Internet Filtering UMR Online Omnibus Results February/March 2012. 66% of respondents were supportive of an extension to the current filter to block other material or images. The sample size was 877 people, with a margin of error of 3.3%.
[10] The most recent survey (2012) excludes Christchurch residents due to the Canterbury earthquakes.
[11] EPIC NZ stands for Ethnic People in Commerce in New Zealand.
[12] The Electronic Identity Verification Bill and the Identity Information Confirmation Bill were progressed through to their second readings during 2011/12.
[13] Private sector use of the Identity Verification Service is subject to Cabinet approval and the passage of the Electronic Identity Verification Bill.
[15] http://paperspast.natlib.govt.nz
[16] http://beta.natlib.govt.nz/
[17] This measure has been updated to reflect the development of the igovt service. The previous measure referred to ‘service agreements with public sector agencies for service integrations with igovt logon and identity verification services’.
[18] Increasing the number of services is dependent on the successful passage of the Identity Information Confirmation Bill.
[19] Thirteen agencies use igovt. The agencies dominating igovt usage are the newly formed Ministry of Business, Innovation and Employment, NZ Transport Agency and the Ministry for Primary Industries.
[20] Although the number of libraries using Te Puna has increased to 246, an overall increase in the number of libraries monitored means the proportion of libraries using Te Puna has decreased over 2011/12.
[21] By 30 June around 40,000 items, or 20 terabytes, had been placed in a secure digital preservation environment.
[22] Deeds Indexes are volumes that record all of the registered transactions against a section of land.
[23] Te Aupouri, Te Rarawa, Ngai Takoto, Ngati Kuri and Ngati Ranginui.
[24] Latest data is from June 2011. Our biannual customer satisfaction survey is under review, pending changes to the State Services Commission Kiwis Count Survey which may enable us to track satisfaction more efficiently.
[25] Kiwis Count Survey, quarterly update, October 2012.
[26] The figure of 24% is based on a basket of indicator services. Result 10 will be measured through continued monitoring of the basket.
[27] IaaS enables agencies to buy computing infrastructure on demand from host vendors (Datacom CSG Limited, Revera Limited or IBM Limited), reducing the need to purchase and maintain separate infrastructure.
[28] Seven agencies signed agreements and a further 16 are under development. Initial forecasts were for three agency agreements. IaaS works by volume and unit-based price reductions for ICT based on the number of agencies in the initiative.
[29] United Nations E-Government Survey 2012. The United Nations e-govt index measures the willingness and capacity of a country to use information and communications technology to deliver public services. It is a weighted average of three dimensions of e-government, normalised to fall within a range of 0 to 1.
[30] On 1 July 2012 the functions of the Charities Commission transferred to the Department and our monitoring function for this entity ceased.
[31] From 2012 the Kiwis Count Survey is being undertaken on a continuous basis, in order to provide more timely information on the quality of the services public sector organisations provide to New Zealanders. 2012 data on satisfaction with government online services is not yet available.
[32] Performance against Ministerial satisfaction measures in the Information Supporting the Estimates of Appropriations for each of our portfolios is provided in Part B.
[33] Ministry of Civil Defence and Emergency Management ‘CDEM Capability Assessment Report’, April 2012.
[34] The three most common languages using Language Line are Mandarin, Samoan and Korean.
[35] Indicators are under development as part of the CDEM Capability Assessment Tool. Work was delayed as a result of the Canterbury earthquakes and will recommence in 2013/14.
[36] The Recordkeeping in Government Survey has been put on hold following the 2010 survey. More useful information about the state of recordkeeping systems and processes is intended to be gathered from the recordkeeping audits being undertaken by Archives New Zealand.
[37] The National Library, Archives New Zealand, the Office of the Government Chief Information Officer and the Office for the Community and Voluntary Sector integrated with the Department on 1 February 2011
[38] Department of Internal Affairs Engagement Survey 2012: Report of Finding, Kenexa/JRA. The employee engagement index is a measure of how engaged employees are within the organisation, including the level of connectedness people feel towards their organisation and their willingness to expend discretionary effort to ensure the organisation reaches it goals.
[39] Data referring to public sector averages is from the 2011 Human Resources Capability Survey, State Services Commission.