Independent Reference Group Briefing Document
- View this information as a PDF (931KB)*
Network Flow:
Quarterly Report:
At the time of writing this report the access attempts reported by the system is over 16 Million. The increase in traffic can be explained by the addition of 2 new service providers.
We have received 25 appeals from users who were attempting to access a blocked site in this quarter; in all instances the received appeals were processed by the review team and found to contain child abuse material thus the site remained on the list.
Some of the text contained in the appeals is below.
- I just want to see it
- I fantasy about my aunt
- I don’t have children
- Its only hentai there is no auctal harm in it
- Curious
- Not Real
- Just to see if its as bad as you say it is ok
- Reaserch
- I like cute boys
- Just looking
- None of your business
During this quarter, 74% of the traffic originated from a referring site with only 10% of the users accessing the material directly, this could be due to the high number of gateway sites now available. Additionally 18% of the users originated from search engines such as google images.
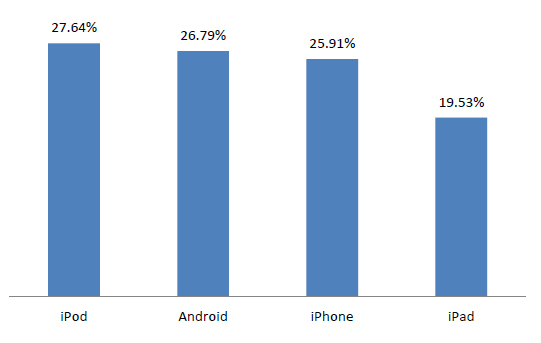
During this quarter Personal Electronic Device traffic accounted for 6.07% of all traffic the breakdown for individual device access is below
System Maintenance:
There are some scheduled works to be completed in the new year relating to standard firmware updates for the systems installed at the datacentre, this activity will be coordinated with the service providers affected to ensure transparency.
System Health:
The system currently has 2.2 million ISP clients, based on numbers supplied to the unit from the providers connected.
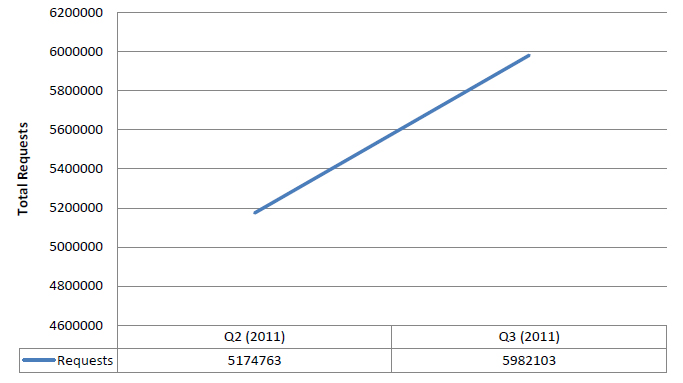
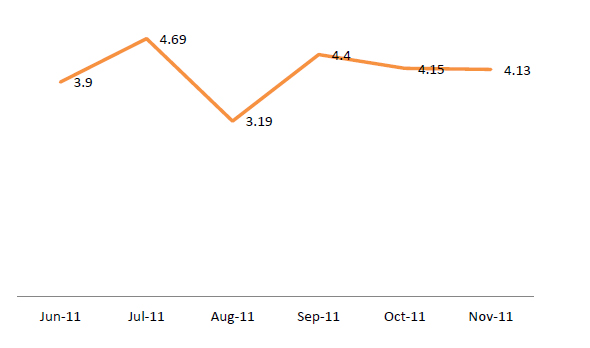
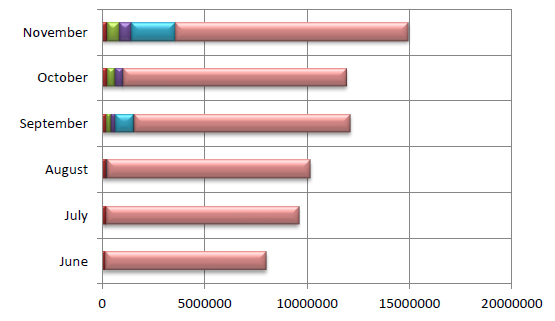
At present we are using approximately 1% of the resources being the filter system itself and processing 500MB-1GB of traffic per day. We have begun recording the total amount of filtered traffic per month and as such can now report the following data trends for Q2 and Q3
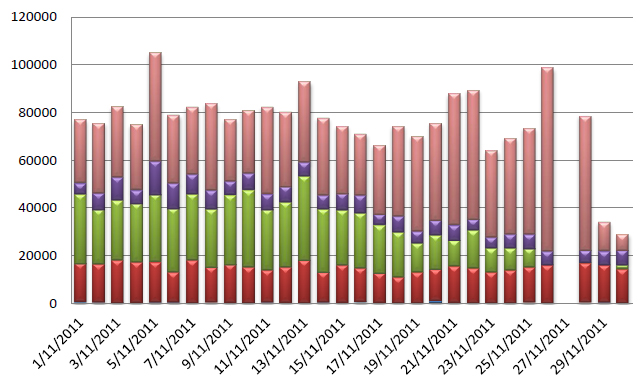
The graph below illustrates the number of blocks recorded by each ISP for the month of November.
The information below depicts the amount of blocks in the last two quarters. The significant increase is due to the addition of some new service providers during this period.
System Updates:
The list has been completely reviewed and sites that are no longer accessible or applicable (due to the removal of Child Exploitation Material) have been removed.
Filter Statistics to Date:
| Number of Providers: | 7 |
| Number of ISP clients filtered: 1 | 2.2 Million |
| Requests Blocked: | 16.1 Million (Increase of 7 million) |
| Filter List Size: | 415 (decrease of 267) |
| Entries Added Since last Quarter: | 61 |
| Entries Removed: | 267 |
| Unique Sites: | 368 |
| Sites containing drawings only (CGI or Hentai) | 82 |
| Traffic: | 500MB – 1GB per day |
| Appeals: | 25 |
1 Number is based on data provided to the unit by the participating service providers
